ThirdEye Data Logo - For Official Use

Spatial IQ AI

Spatial IQ AI is an AI-powered spatial intelligence solution that detects furniture and objects from room images, converts pixel data into real-world measurements, and calculates area coverage automatically.

By combining advanced computer vision, reference-based scaling, and automated analytics, businesses can estimate resource needs, plan logistics, optimize layouts, and generate professional reports in minutes instead of hours.

AI spatial intelligence workflow diagram on laptop, illustrating automated furniture detection, measurement, and reporting processes for interior design and space planning applications.

Business Challenges or Pain Points Addressed

  • Manual measurement and documentation consume hours per room and delay downstream planning.

  • Tape-based calculations and visual estimates often introduce inconsistencies and rework.

  • Teams struggle to understand how much usable space is actually occupied by objects.

  • Portfolio-level assessments are difficult without large field teams.

  • Converting survey results into client-ready reports requires additional effort.

  • Lack of standardization leads to disputes in costing, timelines, and allocation.

Our Solution Approach

Spatial IQ AI automates the end-to-end journey from image input to real-world spatial analytics and reporting.

How it works:

  • AI models detect and segment furniture or objects from photos.

  • Reference calibration converts pixels into feet or meters.

  • Algorithms compute footprint, area coverage, and utilization.

  • Visual overlays validate detections for business users.

  • Reports and APIs distribute structured outputs to other systems.

  • Batch workflows scale across properties, warehouses, or facilities.

Tools & Technologies Used

  • AI Models:YOLOv8 and YOLOv10 for object detection & segmentation

  • Backend:FastAPI with Python

  • Image Processing:OpenCV, PIL

  • Math & Analytics:NumPy, SciPy

  • Frontend / UI:React, TypeScript, Streamlit

  • Reporting:ReportLab

  • Visualization:Matplotlib, Plotly

  • Deployment: Docker, Kubernetes, cross-platform environments

Core Features of This Solution

Sofa illustration representing furniture detection and classification in advanced image processing applications.

Advanced Furniture & Object Detection

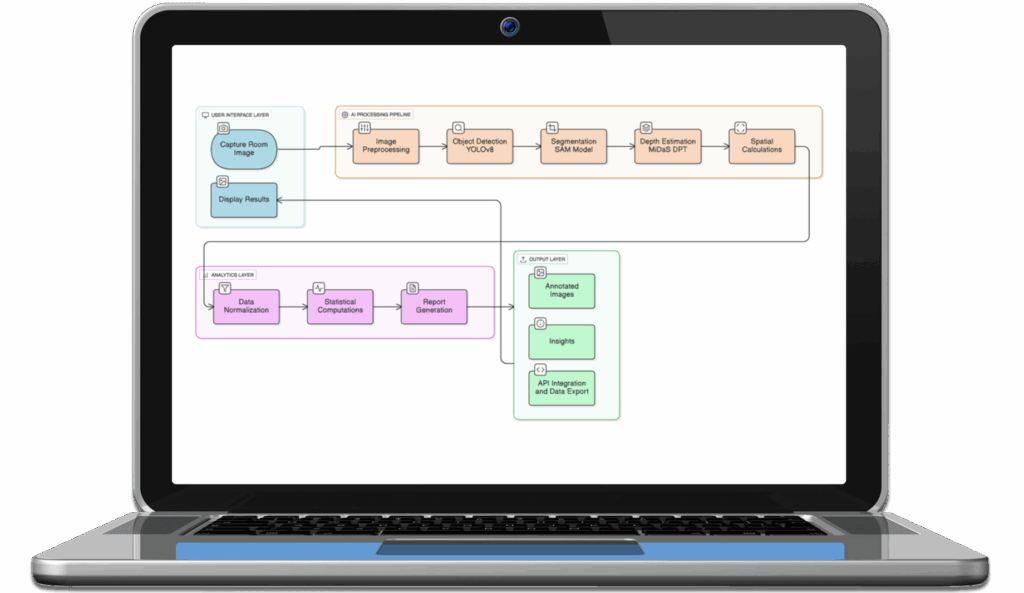
Detects all kinds of furniture and mixed objects with high precision using modern vision models, maintaining reliability even in cluttered environments.

Graphic design tools including a pencil and ruler, representing image processing and scaling calculations for furniture detection and classification.

Automatic Pixel-to-Real-World Scaling

Uses known reference objects and calibration logic to transform pixel dimensions into feet or meters, enabling dependable measurements without site visits.

The provided visual is an icon. It depicts a calculator, which commonly symbolizes mathematical calculation, measurement, quantitative analysis.

Area Coverage & Utilization Analytics

Calculates footprint per item, total occupied area, and percentage utilization, giving planners immediate clarity on capacity, density, and movement feasibility.

The provided visual is an icon. It shows interconnected nodes and colored squares, which typically represent networks, connections, or spatial relationships.

Annotated Visual Validation

Produces images with bounding boxes, labels, and measurement overlays so operations, sales, and clients can visually confirm outputs without technical expertise.

The provided visual is an icon. It features two stylized documents or sheets of paper, which generally symbolize reports, documentation, data records.

Automated Professional Reporting

Generates structured PDF and data outputs containing object lists, sizes, utilization metrics, and visuals, ready for sharing.

Image depicting a coding symbol inside a gear, representing API integration and technology solutions for accurate object detection and measurement in space planning.

Batch & Portfolio Processing

Handles hundreds of rooms or facilities in parallel, making it practical for enterprises managing large property portfolios or logistics operations.

Tangible Business Value Across Functions

Illustration of a team collaboration concept with a central figure surrounded by gear and two supporting figures, representing automated document processing and content management solutions.

Operations & Field Execution

Shrinks measurement cycles from hours to minutes, helping teams schedule manpower accurately, reduce repeat visits, and execute projects faster.

Portfolio folder with documents and images, representing project showcases and professional work.

Logistics & Resource Planning

Understands volume occupied by objects to estimate truck size, packaging effort, loading time, and crew requirements before dispatch.

The provided visual is an icon. It depicts stylized buildings and houses, making it suitable for topics related to spatial intelligence, property measurement, or urban planning in the context of AI applications.

Sales & Pre-Project Estimation

Enables faster, data-backed quotations using AI-verified area metrics, improving win rates and reducing risks.

The visual provided is an icon. It depicts a money bag, a downward trending bar chart, and a yellow arrow, typically symbolizing a decrease in financial value or loss.

Finance & Cost Control

Standardized measurements improve billing accuracy, reduce disputes, and support predictable costing across multi-site engagements.

Diagram showing a multimodal AI assistant workflow that combines OCR, computer vision, and large-language models for interpreting visual data like diagrams and scanned documents.

Design & Space Optimization

Provides clear utilization insights that help teams optimize space calculation and redesign layouts, increase usable capacity, and validate feasibility instantly.

Enterprise agentic AI-based customer loyalty assistant solution blending AI agents, behavior analytics, segmentation and real-time campaign recommendations

IT & Digital Transformation

API-ready outputs integrate easily with the existing ERP, property, or legacy workflow systems, enabling automation beyond the measurement process.

Turn Images into Actionable Spatial Intelligence

Know space usage, cost impact, and resource demand before work begins.

Real-World Value Created Through This Solution

  • Up to 80% reduction in measurement and reporting effort.

  • Near real-time processing, often under seconds per image.

  • Consistent accuracy across hundreds of rooms and properties.

  • Faster quotation, dispatch, and planning decisions.

  • Reduced rework due to standardized, repeatable outputs.

  • Professional documentation generated automatically.

What Makes This Solution Different

Spatial IQ AI goes beyond detection. It links computer vision with measurable operational outcomes like cost, time, and capacity.

The combination of reference-based scaling, analytics, visual proof, and enterprise integration makes it usable by business teams.

FAQs – Answering Common Business Asks

Q1: How accurate are the measurements?
Accuracy typically stays within tight tolerance ranges when reference objects are visible, making outputs dependable for planning, costing, and logistics decisions.

Q2: Do we need special cameras or sensors?
No. Standard mobile or site images are sufficient, provided basic clarity and angle guidelines are followed.

Q3: Can we process multiple properties together?
Yes. Batch workflows allow large portfolios to be analyzed simultaneously with centralized reporting.

Q4: How do teams consume the results?
Through annotated images, downloadable PDFs, and structured API data that can feed enterprise systems.

Q5: Will this replace human verification?
It dramatically reduces manual effort, while teams may still review outputs for exceptional or complex scenarios.

Q6: Can we adapt the system for new object categories?
Yes. Models can be extended or retrained to support additional furniture or operational assets.

Q7: Is it enterprise scalable?
Absolutely. The architecture supports containerized deployment, parallel workloads, and integration into broader automation ecosystems.

Book a Demo to Interact and See It in Action

CONTACT US