How K-Means Works: The Science Behind Smart Grouping
Imagine walking into a massive supermarket. Every day, thousands of customers shop, picking up products that suit their preferences, habits, and lifestyles. As a data analyst, your challenge is to group these customers into meaningful segments — perhaps “bargain hunters,” “premium buyers,” or “impulse shoppers.”
How do you do this when you have no labels, no predefined categories, and only raw data?
That’s where K-Means Clustering — one of the most intuitive and powerful algorithms in unsupervised machine learning — comes into play.
In this deep dive, we’ll explore what K-Means is, how it works, where it shines, and how industries across the globe leverage it to make smarter decisions. We’ll also look at its advantages, limitations, alternatives, and future trends, with real-world projects and FAQs to wrap it all together.
So, let’s embark on a journey to understand why K-Means remains one of the most trusted and widely used algorithms in data science.

What Is K-Means?
At its core, K-Means is an unsupervised machine learning algorithm used to group unlabeled data into clusters based on their similarities. The goal is to find groups (or “clusters”) in your data such that items in the same group are more similar to each other than to those in other groups.
In simple terms, K-Means helps us find structure in chaos.
For example, if you feed customer purchase data into a K-Means model, it might automatically identify distinct groups like:
- Frequent high-spenders
- Occasional shoppers
- Discount-dependent buyers
The algorithm’s name comes from its process:
- “K” = the number of clusters you want to create.
- “Means” = the averaging process that determines the center (centroid) of each cluster.
How Does K-Means Work?
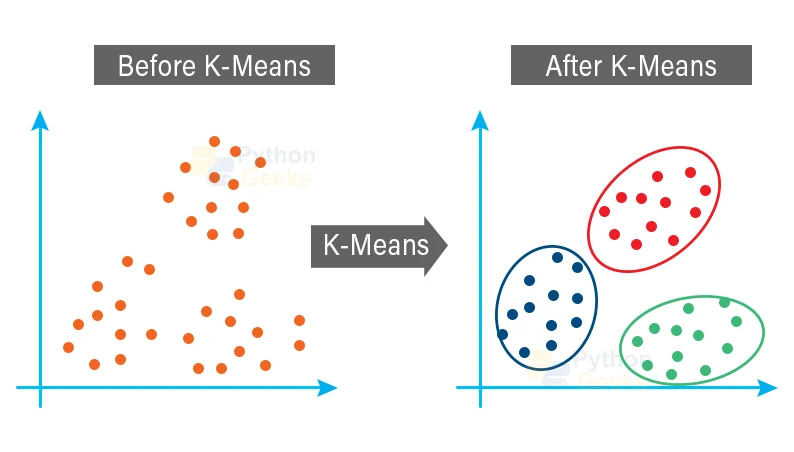
Image Courtesy: pythongeeks
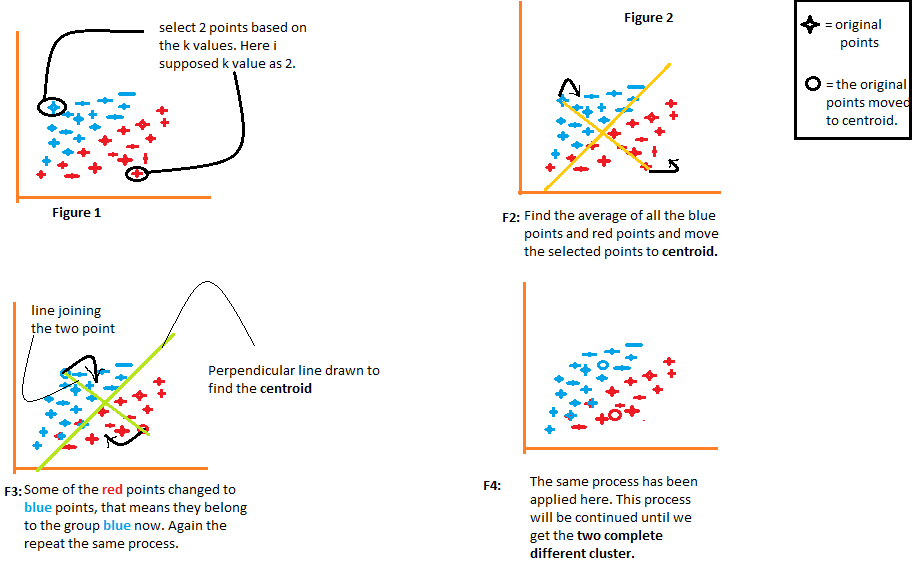
The K-Means algorithm follows an iterative refinement process. Here’s how it works step-by-step:
- Choose the number of clusters (K).
This is a key decision — too few, and clusters are too broad; too many, and they’re too fragmented. - Initialize cluster centroids.
The algorithm randomly selects K data points as the starting centroids. - Assign data points to the nearest centroid.
Using a distance metric (commonly Euclidean distance), each data point is assigned to the closest cluster. - Recalculate centroids.
Once all points are assigned, new centroids are computed as the mean of all points in a cluster. - Repeat until convergence.
The process continues until the centroids no longer move significantly — meaning clusters are stable.
The result?
A clear segmentation of your data into well-defined clusters that share internal similarities and external differences.
A Visual Analogy

K-means Algorithm Flowchart Image Courtesy: revoledu
Imagine throwing a handful of magnetic balls (data points) onto a table. Then, placing K magnets (centroids) around them. Each ball gets pulled toward the closest magnet. Over time, you adjust the magnet positions (recalculate centroids) until they settle into balanced spots.
That’s K-Means in action — clustering through attraction and balance.
K-Means Visualization Image Courtesy: Analytics Vidhya
Use Cases / Problem Statements Solved by K-Means
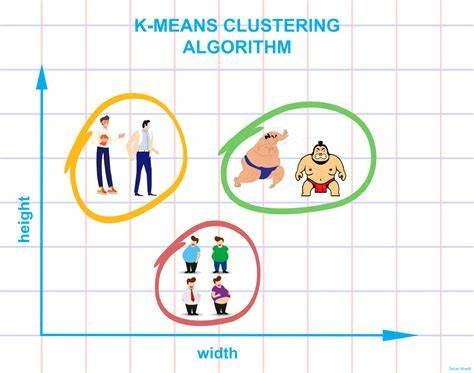
Image Courtesy: lancaster
K-Means is not just a concept in textbooks — it’s used everywhere from e-commerce to astronomy. Let’s explore its diverse applications across industries.
1. Customer Segmentation
Retailers and marketers use K-Means to segment customers based on demographics, purchasing behavior, and preferences.
Example:
An online retailer like Amazon might cluster its users into groups like “tech enthusiasts,” “fashion lovers,” and “budget shoppers.” These insights drive personalized recommendations and targeted marketing campaigns.
2. Banking and Finance
Financial institutions use K-Means to identify customer segments, risk groups, or fraudulent patterns.
Example:
Banks can cluster transactions to detect anomalies — for instance, grouping normal transactions separately from potentially fraudulent ones.
K-Means helps them design risk-based pricing models or detect outlier patterns in credit card activity.
3. Healthcare and Medical Imaging
In healthcare, K-Means plays a major role in disease classification, patient clustering, and medical image segmentation.
Example:
Radiologists use K-Means to segment MRI or CT scans, separating different tissue types, tumor regions, or organs — helping in precise diagnostics and treatment planning.
4. Environmental and Geospatial Analysis
K-Means is valuable for satellite image classification, land-use mapping, and climate pattern identification.
Example:
NASA uses clustering to categorize land cover types — forests, water bodies, and urban areas — from satellite data.
5. Telecommunications and IoT
Telecom companies analyze network usage to optimize services.
Example:
K-Means can group users based on data consumption patterns — heavy streamers vs. casual users — allowing providers to tailor plans and improve bandwidth allocation.
6. Manufacturing and Quality Control
K-Means helps identify defective product batches or cluster machinery readings to predict maintenance needs.
Example:
In predictive maintenance, IoT sensors collect machine data. K-Means can cluster these readings to detect anomalies — signaling when a machine might fail.
7. Education and Research
In academia, K-Means helps cluster students based on performance metrics or research articles based on topics.
This supports better decision-making in personalized learning, academic recommendations, and trend discovery.
Pros of K-Means Clustering
K-Means remains a favorite among data scientists for good reasons:
Simplicity and Efficiency:1. Customer SegmentationPros of K-Means Clustering
Retailers and marketers use K-Means to segment customers based on demographics, purchasing behavior, and preferences.
Example:
An online retailer like Amazon might cluster its users into groups like “tech enthusiasts,” “fashion lovers,” and “budget shoppers.” These insights drive personalized recommendations and targeted marketing campaigns.
2. Banking and Finance
Financial institutions use K-Means to identify customer segments, risk groups, or fraudulent patterns.
Example:
Banks can cluster transactions to detect anomalies — for instance, grouping normal transactions separately from potentially fraudulent ones.
K-Means helps them design risk-based pricing models or detect outlier patterns in credit card activity.
3. Healthcare and Medical Imaging
In healthcare, K-Means plays a major role in disease classification, patient clustering, and medical image segmentation.
Example:
Radiologists use K-Means to segment MRI or CT scans, separating different tissue types, tumor regions, or organs — helping in precise diagnostics and treatment planning.
4. Environmental and Geospatial Analysis
K-Means is valuable for satellite image classification, land-use mapping, and climate pattern identification.
Example:
NASA uses clustering to categorize land cover types — forests, water bodies, and urban areas — from satellite data.
5. Telecommunications and IoT
Telecom companies analyze network usage to optimize services.
Example:
K-Means can group users based on data consumption patterns — heavy streamers vs. casual users — allowing providers to tailor plans and improve bandwidth allocation.
6. Manufacturing and Quality Control
K-Means helps identify defective product batches or cluster machinery readings to predict maintenance needs.
Example:
In predictive maintenance, IoT sensors collect machine data. K-Means can cluster these readings to detect anomalies — signaling when a machine might fail.
7. Education and Research
In academia, K-Means helps cluster students based on performance metrics or research articles based on topics.
This supports better decision-making in personalized learning, academic recommendations, and trend discovery.
- It’s easy to implement and computationally fast, even for large datasets.
- Scalability:
K-Means scales well with the number of samples and features, making it ideal for big data environments. - Interpretability:
The results are easy to visualize and understand, especially in 2D or 3D feature spaces. - Versatility:
It can be used in various domains — from text clustering to image compression. - Low Memory Footprint:
It uses relatively little memory compared to deep learning models. - Quick Convergence:
The iterative process stabilizes quickly in most cases.
Cons and Limitations of K-means
Despite its strengths, K-Means is not perfect.
- Requires K to Be Specified:
You must predefine the number of clusters — which can be tricky. Too many or too few can distort results. - Sensitive to Initialization:
Random starting points can lead to different clustering outcomes. This is partly addressed by techniques like K-Means++. - Assumes Spherical Clusters:
K-Means works best when clusters are roughly circular and equally sized. Irregular shapes pose challenges. - Outlier Sensitivity:
A single outlier can shift a centroid significantly. - Poor for Categorical Data:
It primarily handles numerical data; for categorical data, alternatives like K-Modes or K-Prototypes are better.
Alternatives to K-Means
When K-Means isn’t the best fit, several alternatives come into play:
- Hierarchical Clustering:
Builds a tree-like structure (dendrogram) to represent relationships between clusters. - DBSCAN (Density-Based Spatial Clustering):
Groups data points based on density, allowing arbitrary-shaped clusters and identifying noise. - Gaussian Mixture Models (GMM):
Probabilistic approach allowing data points to belong to multiple clusters with varying degrees of membership. - Mean Shift:
Detects clusters without predefining K, using the concept of kernel density estimation.
Each of these alternatives handles noise, shape, or initialization issues better depending on the data type and structure.
Upcoming Updates / Industry Insights of regarding K-means
Deep clustering models now combine neural networks with K-Means for high-dimensional data like images or speech signals.
Trend 2: Real-time Clustering
Streaming data environments (like IoT or social media) are adopting Online K-Means to continuously update clusters as new data arrives.
Trend 3: Explainable Clustering
New frameworks focus on interpretable clustering — explaining why certain points belong to specific groups, enhancing trust and usability.
Trend 4: Automation and AutoML
AutoML platforms now include automated K-Means tuning, choosing optimal K and initialization methods automatically.
Project References
Frequently Asked Questions of K-means
Q1. How do I choose the right K value?
Use methods like the Elbow Method, Silhouette Score, or Gap Statistic to determine an optimal K.
Q2. Can K-Means handle non-numerical data?
Not directly — but extensions like K-Modes and K-Prototypes allow for categorical and mixed data.
Q3. Is K-Means suitable for high-dimensional data?
It can be, but dimensionality reduction (e.g., PCA) is often applied before clustering.
Q4. What’s the difference between K-Means and DBSCAN?
K-Means needs predefined K and works best with spherical clusters, while DBSCAN automatically detects clusters based on density.
Third Eye Data’s Take on K-means
K-Means isn’t just a machine learning algorithm — it’s a gateway to discovering patterns hidden in data. Its simplicity, scalability, and interpretability make it one of the most practical tools for data segmentation and analytics.
From marketing to medicine, from retail to robotics — K-Means continues to power insights that drive intelligent decisions.
In a world overflowing with unstructured data, the ability to cluster intelligently is no longer optional — it’s essential.
Call to Action
Are you ready to bring structure to your data chaos?
Start experimenting with K-Means Clusteringtoday using libraries like Scikit-learn, TensorFlow, or PyTorch.
Try clustering your customers, segmenting your data, or analyzing market trends — you’ll be amazed at what hidden patterns emerge when you let your data speak for itself