Looker: The Enterprise BI Powerhouse for Data-Driven Teams
Introduction: From “Data Chaos” to “Single Source of Truth”
Picture this: your business has data scattered everywhere — sales in Salesforce, web traffic in Google Analytics, financials in QuickBooks, product usage logs in a data warehouse, and marketing campaign data in spreadsheets. Every team has its own “reporting stack” and often they don’t align: one says “revenue grew 8%,” another says “7%,” and you can’t easily reconcile them.
You know the pain: fractured metrics, duplicate calculations, lack of trust in dashboards. Senior leadership starts asking, “Which number is right?”
This is where Looker enters the scene. Looker is built to be a governed, semantic BI platform that provides a single source of truth — a place where data teams define metrics centrally, users explore data with confidence, and insights drive actions. It’s less of a dashboard tool and more of a data platform + BI interface.
In this blog, we’ll dive deep into Looker:
- What Looker is (and how it’s different from dashboards)
- Use cases and problems it solves
- Its architecture and how it connects across the stack
- Pros, cons, and comparisons
- Trends, updates, and industry insights
- Real-world references & case studies
- FAQs and best practices
- Conclusion & next steps
By the end, you’ll understand not only what Looker can do, but why it’s a vital piece in many enterprise data stacks.
What Is Looker?
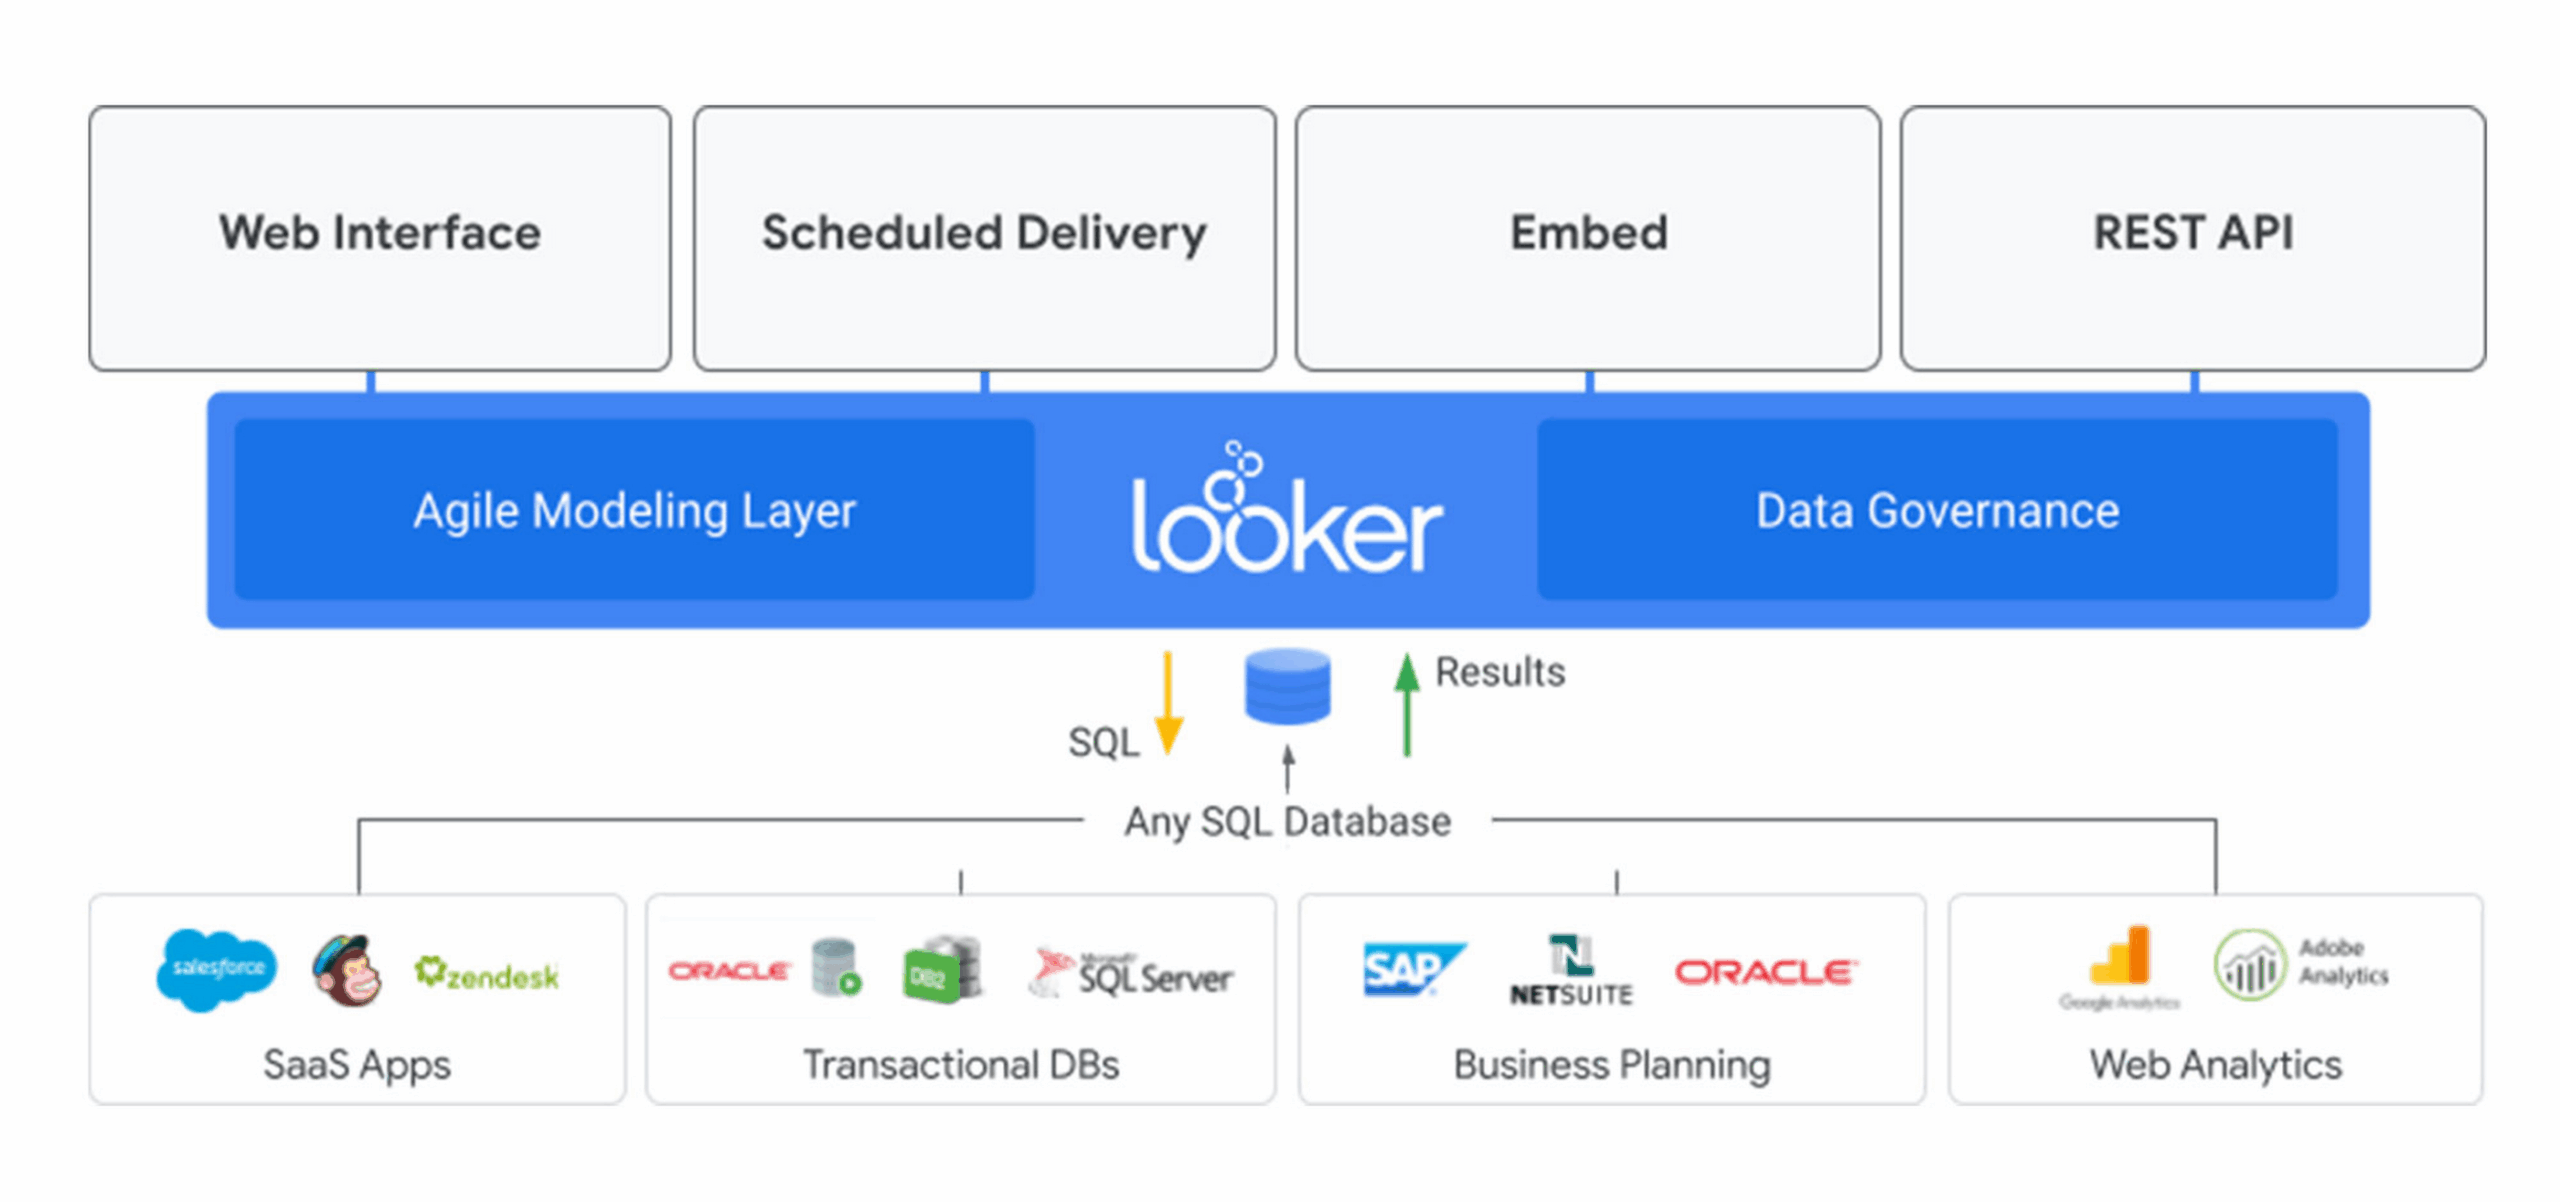
Image Courtesy: google cloud
Looker is Google Cloud’s business intelligence (BI) and data analytics platform — built for enterprises that want governance, modeling, and consistent metrics, not just dashboards. It acts as both a modeling layer and a user-facing analytics interface.
Key points:
- It uses a modeling language called LookML which defines how raw data (tables, joins, metrics, dimensions) maps to business logic.
- It enables users (analysts, business users) to explore data via “Explore” interfaces, dashboards, looks, drill-downs, and embeds.
- Looker is cloud-native / modern-architecture, designed to work with modern data warehouses (e.g., BigQuery, Redshift, Snowflake).
- With Looker on Google Cloud, it integrates with Google’s security, IAM, infrastructure, and ecosystem.
- It offers embedded analytics / data apps capabilities, meaning you can integrate analytics within your own products or workflows.
So, Looker is not “just another dashboard tool.” It is a data modeling + analytics platform that emphasizes governance, consistency, and embedded analytics at scale.
History & Acquisition
- Looker was founded in 2012.
- In June 2019, Google announced acquisition of Looker for $2.6B; the acquisition completed in early 2020.
- With this acquisition, Google positioned Looker as its enterprise BI offering to complement Google Cloud’s data, AI, and analytics stack.
The move reflected Google’s aim to close gaps in its analytics ecosystem. Instead of building a BI tool from scratch, acquiring Looker gave them a mature, enterprise-grade platform.
Distinction from Looker Studio
A frequent confusion: Looker vs. Looker Studio (previously Data Studio). While both are BI/analytics tools, they operate in different tiers and use cases:
- Looker Studio is more of a self-service reporting & dashboard tool (free / light-weight) for marketing, business users, and ad-hoc reports.
- Looker is enterprise-grade, with modeling, governance, embedded analytics, and deep integration with data infrastructure.
- They coexist: your team may use Looker for governed metrics and data applications, and Looker Studio for exploratory or ad-hoc reporting.
Thus, Think of Looker as the “backbone BI platform” enabling structure & consistency, whereas Looker Studio is an easier front-layer for visualizing or sharing.
Use Cases / Problems Solved by Looker
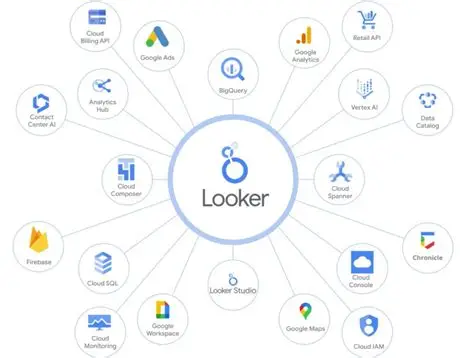
Image Courtesy: martingaray
Let’s ground theory in real problems. What scenarios or organizational challenges push teams to adopt Looker?
- Metric Inconsistency & BI Silos
Problem: Marketing, Finance, Ops teams each maintain their own dashboards; definitions differ; numbers don’t match.
Solution with Looker: Using LookML, data teams encode business logic (e.g. CTR, LTV, churn) centrally. All users interact with the same definitions, producing consistent metrics.
- Embedding Analytics Inside Apps (Data Products)
Problem: You have a SaaS product, and you want to give customers analytics dashboards without building it from scratch.
Solution: Looker’s embedded analytics / API-first capabilities allow you to place dashboards, explorations, or charts inside your application seamlessly.
- Real-time / Near-real-time Analytics
Problem: Reports are stale; business needs live insights (e.g. conversions during a marketing campaign).
Solution: Looker queries directly against your data warehouse (e.g. BigQuery) so reports reflect current data, subject to warehouse latency.
- Scalability & Governance in Large Organizations
Problem: In a large company, hundreds of dashboards, thousands of users, and fragmenting logic create chaos.
Solution: Looker’s modeling layer, permission controls, versioning, and dev/production workflows manage complexity and maintain stability.
- Advanced Analytics & Actionability
Problem: Insights are nice, but you want analytics to trigger actions (e.g. alert if KPI dips, trigger workflows).
Solution: Looker supports alerts, scheduled reports, and integration with APIs or workflows so analytics can drive operations.
- Multi-cloud / Cross-database Analytics
Problem: Your data resides across clouds or databases (BigQuery, Snowflake, Postgres).
Solution: Looker supports connecting to multiple databases and modeling logic to span those sources, enabling unified access to cross-system data.
Anecdotal Story
A retail company had separate dashboards for online vs offline sales, inventory, and campaigns. When they switched to Looker, they built a central “Metrics Layer.” Marketing and operations began trusting the same numbers—everyone saw “Total Sales” the same way. That clarity reduced friction in cross-team decisions.
Architecture & How Looker Connects
Understanding Looker’s architecture and how its components connect is key to grasping its power. I’ll break it down and show how it fits into your data stack.
Core Components / Layers
| Layer | Role | Key Features |
| Database / Warehouse | Where raw data lives | BigQuery, Snowflake, Redshift, PostgreSQL, etc. |
| Data Modeling (LookML Engine) | Defines metrics, relationships, joins, derived tables | LookML code, version control, modular modeling |
| Explore / Query Engine | User-driven data exploration interface | Generates queries dynamically based on user selections |
| Visualization / Dashboard Layer | Dashboards, Looks, tiles, embedded dashboards | Charts, filters, dashboards, drill-downs |
| APIs / Embedding | External integration and embedding | REST / SDK APIs, embedding features |
| Governance / Permissions | Access control, dev / prod modes, versioning | Roles, permissions, model versioning, project deploys |
| Alerts / Schedules / Actions | Scheduled data delivery, alert triggers | Email reports, dashboard alerts |
Data Flow & Interaction
- Data resides in a warehouse / database (e.g., BigQuery).
- LookML models define how raw tables map to business logic (joins, measures, dimensions).
- User or app initiates an exploration/dash request (via Explore or dashboard).
- Looker query engine composes a SQL query according to LookML logic + filters + drill-downs.
- Database executes query, returns result.
- Looker visualizes the result via charts, dashboards, embedded UI.
- Alerts, schedules, or API triggers may act on data (download CSVs, send emails).
- Embedding or external apps may show these charts or query results in external UIs.
Because Looker pushes down queries to the warehouse, it benefits from warehouse scale and doesn’t maintain its own data store (except caching). It’s often described as a “no-ETL” or “in-database BI” approach.
Connection with GCP / Analytics Ecosystem
- BigQuery: Looker deeply integrates; many use cases involve Looker + BigQuery as the core analytics stack.
- Other Data Sources: Looker also supports connecting to other SQL-based sources, enabling federation.
- Looker on Google Cloud: As part of Google Cloud, Looker inherits IAM, networking, private VPC, security features.
- Embedded Analytics / Looker Extensions / APIs: To build data apps, using Looker as a data backend and embedding via APIs.
- Generative / Conversational Analytics: Google is pushing conversational BI where users can ask questions in natural language and get responses rendered with charts.
Thus, Looker is not isolated—it’s designed to be central in an analytics stack bridging data, modeling, and action.
Pros of Looker
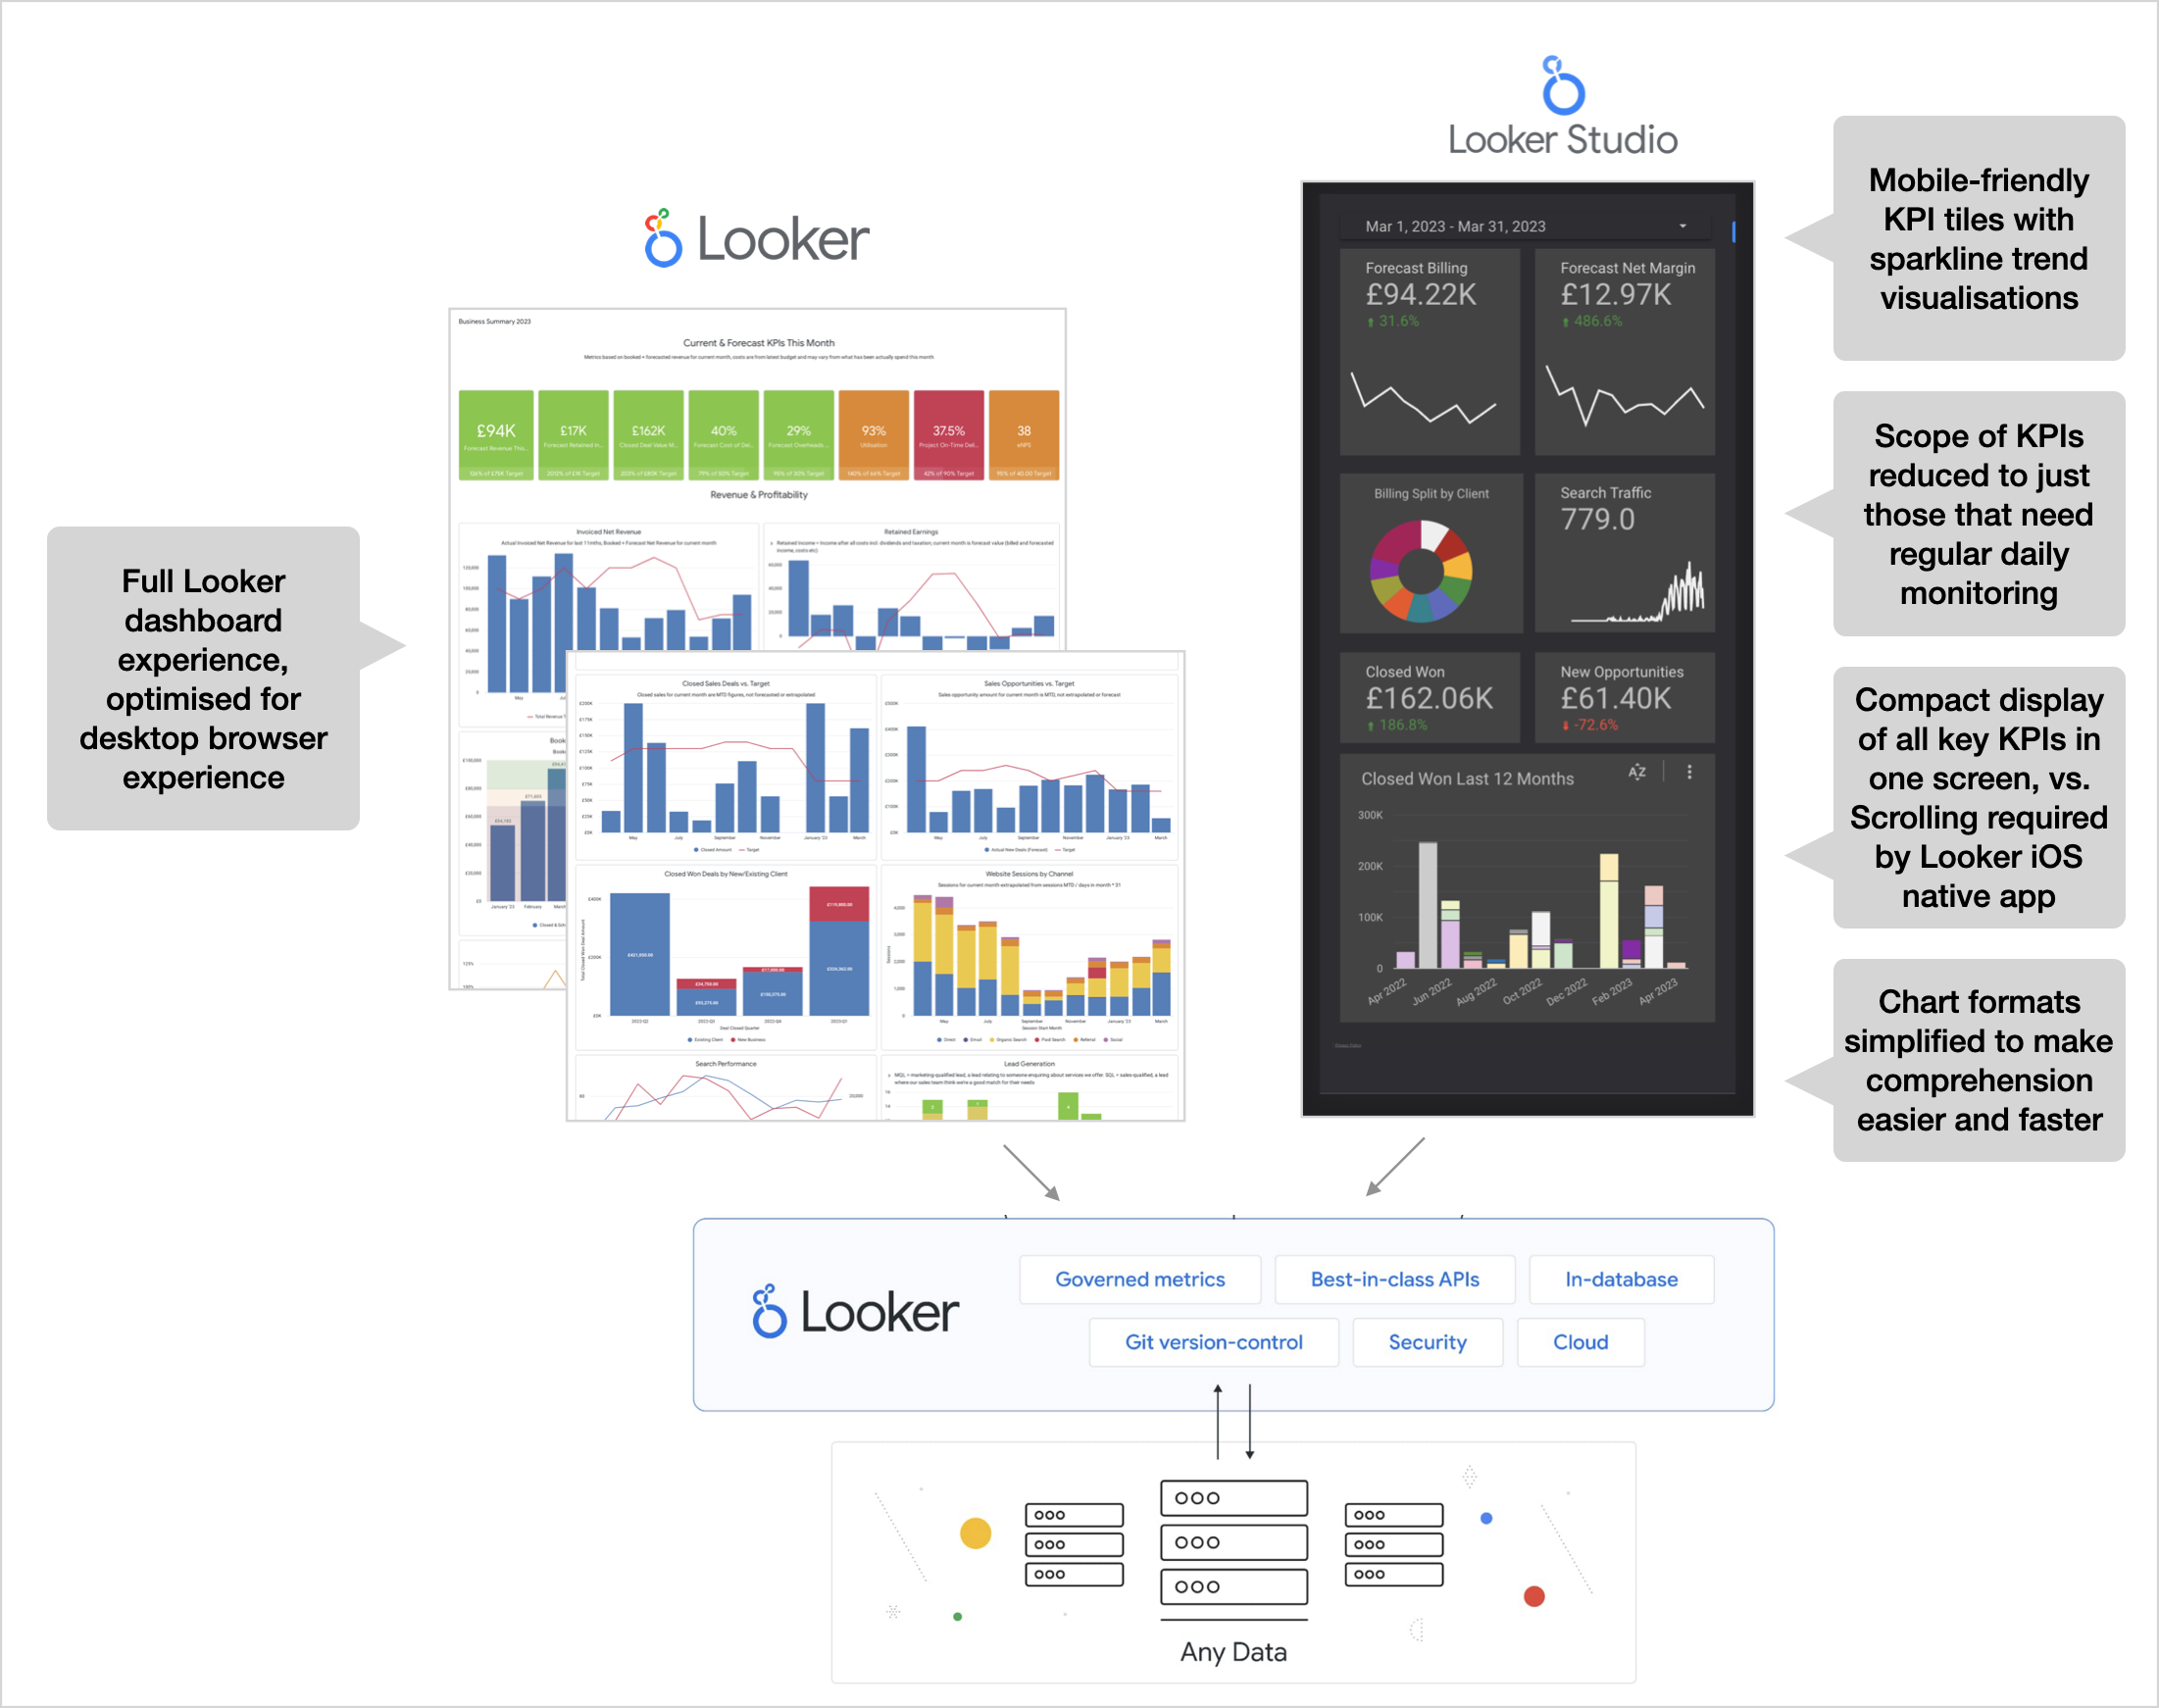
Image Courtesy: riitmananalytics
Let’s highlight strengths from the lens of experience, authority, and developer/business alignment.
Semantic Modeling & Consistency
Because LookML models are defined centrally, business metrics remain consistent across dashboards, reducing fragmentation and trust issues.
Scalability & Query Pushdown
Looker runs queries in the data warehouse (BigQuery, etc.), which scales naturally and avoids maintenance of its own data store.
Embedded & API-first
If you need analytics inside your product, Looker supports embedding, APIs, and building data applications using Looker as a backend.
Governance, Version Control, Dev/Prod Mode
You can maintain version control on models, stage changes, and deploy safely to production with governance controls.
Alerts, Schedules, Delivery
Looker supports scheduled reports, alerts, data exports and integration with operational workflows.
Real-Time or Near-Real-Time Insights
Because Looker queries live data sources, dashboards reflect up-to-date information, assuming your data pipeline supports that.
Deep Integration in Google Ecosystem
When used with GCP, integration with IAM, BigQuery, security, and identity makes deployment and access control smoother.
Strong Enterprise Adoption & Community
Looker has been adopted by large enterprises across industries; it’s battle-tested in large-scale BI deployments.
Cons / Challenges of Looker
No tool is perfect—Looker has trade-offs and limitations you should be aware of.
Learning Curve (LookML & Data Modeling)
While users may interact via Explore, it takes training to model effectively in LookML. Good models require thoughtful design.
Query Cost & Performance
Because Looker pushes queries to the warehouse, poorly written dashboards or inefficient models can incur high costs or slow queries.
Dependency on SQL / Database Support
Because the power relies on SQL backends, non-SQL sources or advanced data transformations outside SQL may be harder to integrate.
Licensing & Costs
Looker is a premium enterprise product with licensing beyond just users—it includes platform, embedding, API calls, etc.
Deployment & Operations Overhead
Running a Looker instance (or using Looker on Cloud) requires operations: backups, scaling, version upgrades, monitoring.
Use Case Fit
For lightweight dashboards, or small teams, Looker might be overkill. Simpler BI tools or reporting tools may suffice.
Alternatives & Comparisons
If Looker isn’t the right fit, here are other platforms to consider and how they differ:
- Tableau — mature, rich visualization capabilities, strong in visual exploration.
- Power BI — often preferred in Microsoft / Office-centric environments.
- Looker Studio — for more flexible, self-service reporting; less governance, lighter weight.
- Mode Analytics, Superset, Metabase, Redash — open-source or lighter BI tools.
- Sisense, Qlik, ThoughtSpot — enterprise BI / analytics platforms with other strengths (in-memory, search-driven analytics).
Compared to many, Looker’s uniqueness lies in its semantic modeling, embedded analytics, and tight integration with data infrastructure.
Upcoming Updates & Industry Insights
Let’s look at recent releases, roadmaps, and trends to watch in Looker.
Latest Versions & Release Notes
- Looker 25.6 is expected deployment around July 30, 2025.
- Looker 25.8 is also coming in 2025.
- Looker 25.4 was released earlier in 2025.
These releases typically introduce new features, performance enhancements, UI improvements, and integrations.
At Google Cloud NEXT 2025 & Roadmap Highlights
- Conversational Analytics is becoming more central — users can ask natural language questions within Looker and get charted responses.
- Looker is increasingly embedding Gemini / AI models to assist analysts and automate visualization/metric creation.
- The “Agentic architecture” within Looker (managing query lifecycles) is being discussed publicly, reflecting more intelligent orchestration behind the scenes.
Trends & Insights
- BI and analytics are moving from static dashboards to embedded, interactive, AI-augmented analytics.
- Semantic layers and governed metric definitions will be indispensable in enterprises to fight “dashboard sprawl.”
- The blending of BI + ML + conversational queries is accelerating — allowing business users to ask “Show me top markets by projected churn next quarter.”
- Real-time & streaming analytics pressures push BI tools to optimize for lower latency and incremental query approaches.
- Multi-cloud and cross-database analytics are becoming more important as organizations don’t live in a single cloud.
Project References
Frequently Asked Questions on Looker
Let’s look at recent releases, roadmaps, and trends to watch in Looker.
Latest Versions & Release Notes
- Looker 25.6 is expected deployment around July 30, 2025.
- Looker 25.8 is also coming in 2025.
- Looker 25.4 was released earlier in 2025.
These releases typically introduce new features, performance enhancements, UI improvements, and integrations.
At Google Cloud NEXT 2025 & Roadmap Highlights
- Conversational Analytics is becoming more central — users can ask natural language questions within Looker and get charted responses.
- Looker is increasingly embedding Gemini / AI models to assist analysts and automate visualization/metric creation.
- The “Agentic architecture” within Looker (managing query lifecycles) is being discussed publicly, reflecting more intelligent orchestration behind the scenes.
Trends & Insights
- BI and analytics are moving from static dashboards to embedded, interactive, AI-augmented analytics.
- Semantic layers and governed metric definitions will be indispensable in enterprises to fight “dashboard sprawl.”
- The blending of BI + ML + conversational queries is accelerating — allowing business users to ask “Show me top markets by projected churn next quarter.”
- Real-time & streaming analytics pressures push BI tools to optimize for lower latency and incremental query approaches.
- Multi-cloud and cross-database analytics are becoming more important as organizations don’t live in a single cloud.
Third Eye Data’s Take
We include Lookeras part of our preferred BI / dashboarding toolkit. At Third EyeData, Looker plays a role in delivering analytics layers over AI / data systems—especially when we want to provide clients with governed, interactive dashboards backed by rich data models. Although not always front-facing in demos, we see Looker as part of our full-stack data + AI delivery capabilities.
In the evolving world of data, dashboards are no longer enough. Teams need governed, consistent, scalable analyticsthat tie tightly to the data infrastructure and business logic. Looker delivers that through its modeling layer, query pushdown architecture, embedded analytics, and growing AI integrations.
For organizations grappling with metric inconsistency, dashboard sprawl, embedding analytics in apps, or governance headaches, Looker offers a powerful solution. When paired with modern data warehouses (like BigQuery) and AI tools (like Vertex AI), Looker becomes more than BI — it becomes the analytic nervous systemof the organization.
Call to Action: Get Hands-on with Looker
- Sign up for a Looker trial(or request a demo from Google).
- Build a simple model in LookML— define one derived metric (e.g. conversion rate) and expose it.
- Create a dashboard / Explore viewusing that model, with filters and drill-down.
- Embed that dashboardin a test web page or application to experience the embedding APIs.
- Explore conversational analytics(if available in your version) — ask a question and see charted output.