Agentic AI-based Financial Research Tool

The Agentic AI-based Financial Research Tool transforms traditional equity and sector research. By automating data collection, analysis, and report generation, it replaces 40–60 hours of manual work with an 8-minute AI-driven analysis. The system produces institutional-grade, bias-free research reports while scaling coverage across 50+ companies simultaneously. This enables faster, accurate, and cost-efficient financial intelligence for investment teams and research analysts.

The visual provided is a flowchart displayed on a laptop screen.

Business Challenges or Pain Points Addressed

  • Analysts spend 70% of their time gathering data, slowing report delivery.

  • Manual processes introduce errors, inconsistencies, and bias.

  • Coverage is limited to 2–3 companies per week, restricting research breadth.

  • High operational costs for generating professional-grade reports.

Our Solution Approach

We built an agentic AI-powered platform that automates financial research end-to-end:

  • Automated Data Gathering: Real-time crawling, multi-page extraction, and smart filtering.

  • AI-Driven Analysis: Standardized, professional-grade insights with no missing data.

  • Actionable Reporting: Investment thesis, bull/bear cases, risk assessment, and catalyst timeline.

  • Scalable Coverage: Analyze 50+ companies concurrently, dramatically expanding research reach.

  • Cost Optimization: Reduces research costs by ~90% while improving accuracy and consistency.

Technologies Used

  • Data Collection: Firecrawl API for real-time content extraction.

  • AI Processing: Google Gemini 2.5 Flash for natural language understanding and analysis.

  • Frontend / Prototype: Streamlit interface for interactive input and real-time progress tracking.

  • Reporting & Delivery: SMTP/Gmail integration for client-ready institutional reports.

  • Customization: Tech stack can be tailored to client environments and business requirements.

Core Features of This Solution

Laptop with document downloading, illustrating data management and digital workflows.

Robust Input Configuration for Customized Sector-specific Analysis

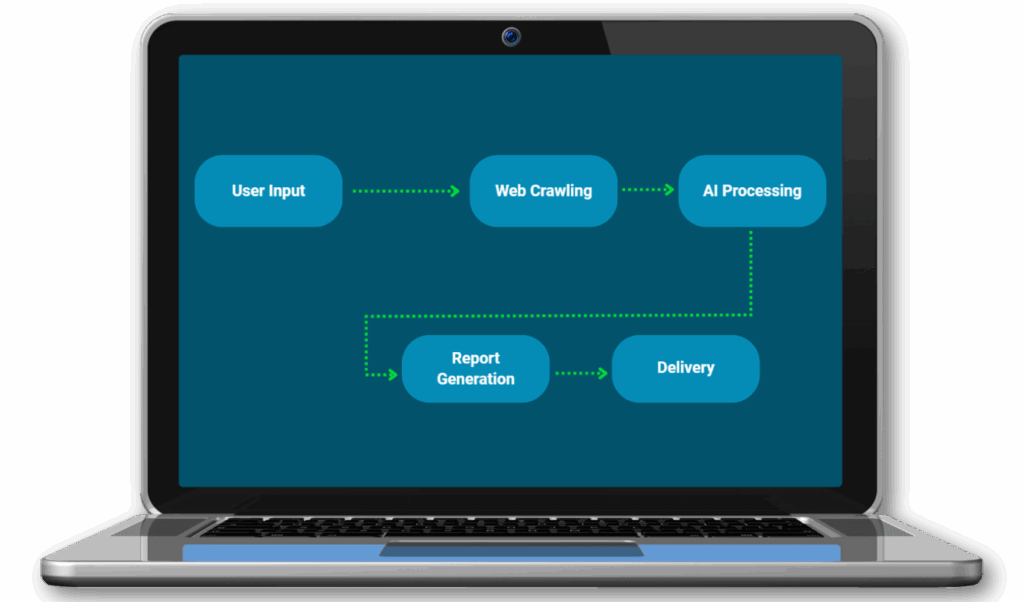
Select research focus, enter URLs, set dynamic prompts, and customize sector-specific analysis with client-driven parameters.

The provided visual is an icon, likely representing a web crawler or a spider-bot, often used in the context of AI-based financial research tools or automated data extraction platforms.

Real-Time Crawling

Track live progress, extract content across multiple pages, apply smart filters, and ensure comprehensive data collection for analysis.

Three blue computer screens with a gear icon, representing automation and technology integration.

AI Processing

Automatically analyze content, enhance data quality, fill missing values intelligently, and produce professional-grade investment insights.

Data visualization dashboard featuring pie chart and bar graph, illustrating financial analysis and investment insights relevant to real-time data processing and reporting.

Results Display

Visualize financial analysis, investment thesis, risk assessment, bull/bear cases, and catalyst timelines with actionable intelligence.

Email report with financial graphs and data analysis in a folder, representing institutional report generation and delivery.

Email Report Generation

Deliver institutional-grade reports in HTML or text format with professional styling, ready for client distribution.

Tangible Business Value Across Functions

Illustration of a team collaboration concept with a central figure surrounded by gear and two supporting figures, representing automated document processing and content management solutions.

Research Analysts

Reduce research time by 99%, allowing focus on high-level strategic decisions rather than manual data gathering.

Portfolio folder with documents and images, representing project showcases and professional work.

Portfolio Managers

Gain 25x coverage expansion, enabling analysis across multiple sectors and companies simultaneously.

Checklist with green checkmarks and a red warning triangle, symbolizing compliance and risk management in financial reporting and data analysis.

Compliance & Risk Teams

Ensure consistent, bias-free reporting, reducing errors and supporting verifiable, transparent decision-making.

Programmer with a laptop and thought bubble, representing coding and problem-solving in technology.

IT & Operations

Implement scalable, customizable workflows compatible with existing systems for cost-efficient deployment.

Enterprise agentic AI-based customer loyalty assistant solution blending AI agents, behavior analytics, segmentation and real-time campaign recommendations

Finance Leadership

Achieve $160K+ annual savings per analyst while improving accuracy and consistency of financial research.

See It in Action

Book a demo to explore automated financial research with institutional-grade quality.

Real-World Value Created Through This Automation

  • 8-minute AI analysis vs 40–60 hours of manual work.

  • 50+ companies analyzed concurrently, compared to 2–3 manually.

  • Standardized professional reports reduce errors and human bias.

  • Research costs reduced by 90%, enabling significant operational savings.

What Makes This Solution Different

This solution combines agentic AI orchestration, real-time crawling, and professional-grade AI processing to deliver high-quality, scalable financial insights rapidly and reliably.

FAQs – Answering Common Business Asks

  • How quickly can the AI generate research reports?
    Approximately 8 minutes per company, replacing manual 40–60 hour workflows.

  • Can it handle multiple companies at once?
    Yes, the tool can analyze 50+ companies simultaneously.

  • Are the reports professional-grade?
    Absolutely, designed to match institutional standards similar to top-tier research firms.

  • Can we customize the tech stack?
    Yes, the platform is modular and can integrate with client-specific APIs and systems.

  • How accurate is the AI analysis?
    Professional-level accuracy with bias minimization and intelligent data enhancement.

Book a Demo to Interact and See It in Action

CONTACT US