Dashboard anything. Observe everything.
Query, visualize, alert on, and understand your data no matter where it’s stored. With Grafana you can create, explore and share all of your data through beautiful, flexible dashboards.
Grafana doesn’t require you to ingest data to a backend store or vendor database. Instead, Grafana takes a unique approach to providing a “single-pane-of-glass” by unifying your existing data, wherever it lives.
With Grafana, you can take any of your existing data- be it from your Kubernetes cluster, raspberry pi, different cloud services, or even Google Sheets- and visualize it however you want, all from a single dashboard.
Grafana was built on the principle that data should be accessible to everyone in your organization, not just the single Ops person.
By democratizing data, Grafana helps to facilitate a culture where data can easily be used and accessed by the people that need it, helping to break down data silos and empower teams.
Not only do Grafana dashboards give insightful meaning to data collected from numerous sources, but you can also share the dashboards you create with other team members, allowing you to explore the data together.
With Grafana, anyone can create and share dynamic dashboards to foster collaboration and transparency.
Translate and transform any of your data into flexible and versatile dashboards. Unlike other tools, Grafana allows you to build dashboards specifically for you and your team.
With advanced querying and transformation capabilities, you can customize your panels to create visualizations that are actually helpful for you.
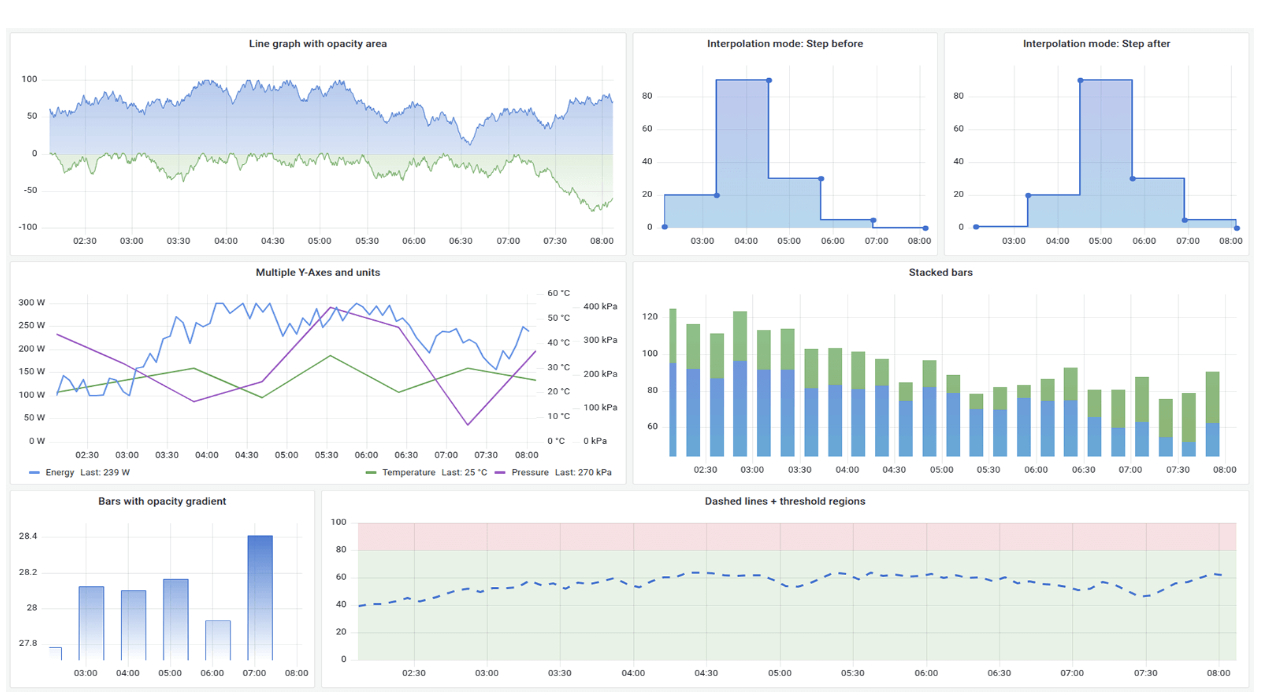
From heatmaps to histograms. Graphs to geomaps. Grafana has fast and flexible visualizations that allows you to visualize your data, any way you want.
Connect your tools and your teams with Grafana plugins. Data source plugins hook into existing data sources via APIs and render the data in real time without requiring you to migrate or ingest your data.
With Grafana Alerting, you can create, manage, and silence all of your alerts within one simple UI— allowing you to easily consolidate and centralize all of your alerts.
Transformations allow you to rename, summarize, combine, and perform calculations across different queries and data sources.
Annotate graphs with rich events from different data sources. Hover over events shows you the full event metadata and tags.
The panel editor makes it easy to configure, customize and explore all of your panels with a consistent UI for setting data options across all of your visualizations.
Information Source – https://grafana.com/grafana/?plcmt=footer