From Chaos to Clarity: How Prometheus + Grafana Bring Your Metrics to Life
“We were drowning in logs, alerts, and dashboards that told us only that something was wrong—but not why. Then we discovered Prometheus and Grafana. Suddenly, our systems spoke to us.”
That’s a refrain I’ve heard (and felt) from many teams over the years. Monitoring is more than watching—it’s understanding. And the popular duo of Prometheus + Grafanahas become the de facto standard in many observability stacks. Together, they let you collect, query, visualize, and alert on time-series metrics—with clarity, flexibility, and control.

In this post, we’ll unpack everything you need to know:
- What are Prometheus and Grafana — and how do they complement each other
- Real-world use cases and problem statements they solve
- Pros, cons, and trade-offs
- Alternatives & when they might be better
- Recent updates, roadmaps, and industry trends
- Project references / sample architectures
- FAQs (common stumbling blocks)
- Closing thoughts + call to action
Let’s dive in.
Prometheus + Grafana: Overview & Their Relationship
What is Prometheus?
Prometheus is an open-source system monitoring and alerting toolkit, built for reliability, scalability, and multi-dimensional data.
- It follows a pull-basedmodel: Prometheus “scrapes” metrics (via HTTP endpoints) from instrumented services or exporters.
- It stores data in a time-series database, with each metric having a name and optional labels (key=value pairs), enabling multi-dimensional querying.
- It supports powerful queryingvia its PromQL language, enabling slicing, dicing, aggregations, and transformations.
- It can evaluate rules(recording rules, alerting rules) to derive new metrics or trigger alerts.
- It often works with Alertmanagerto send notifications (Slack, email, PagerDuty, etc.) when conditions are met.
In short: Prometheus is your engine for collecting and storing time-series metrics, and making them queryable.
What is Grafana?
Grafana is an open-source (with enterprise editions) data visualization and analytics platform.
- It supports multiple data sources (Prometheus, InfluxDB, Elasticsearch, Graphite, SQL, Loki, etc.).
- You build dashboards, combining panels (graphs, tables, stats, heatmaps, alerts) in a flexible layout.
- Grafana enables explorationof data, ad hoc queries, filtering, templating, drilldowns.
- It integrates with alerting, annotations, reporting, plugin ecosystem, sharing and user access controls.
How They Fit Together (and Why the Pairing Works)
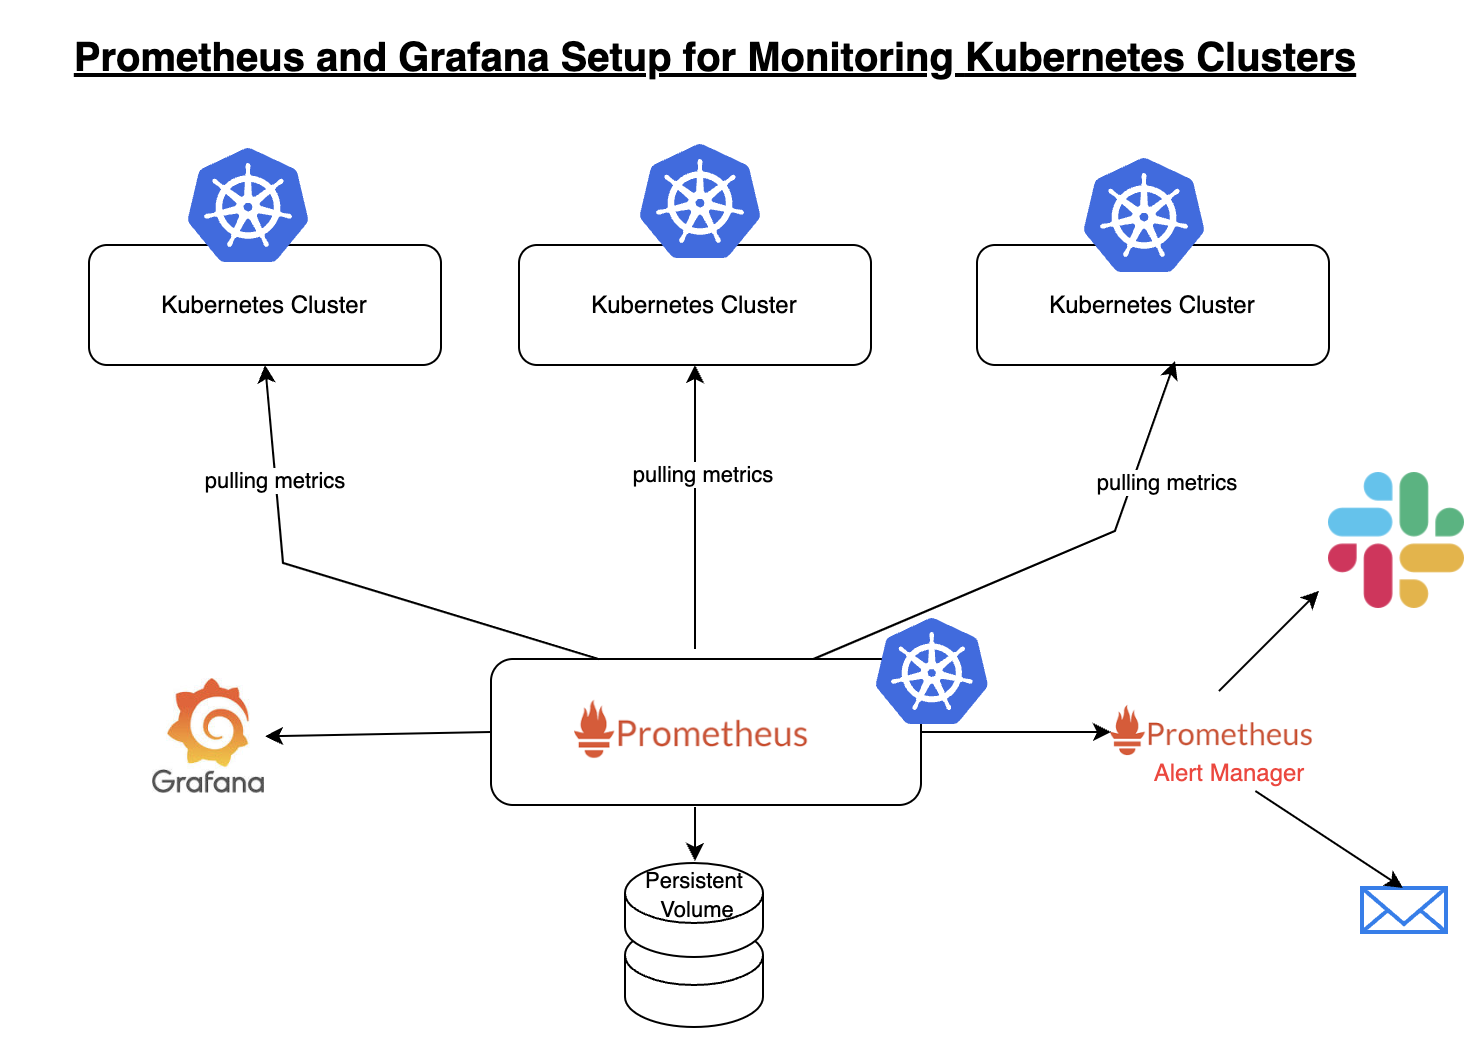
Image Courtesy: coachdevops
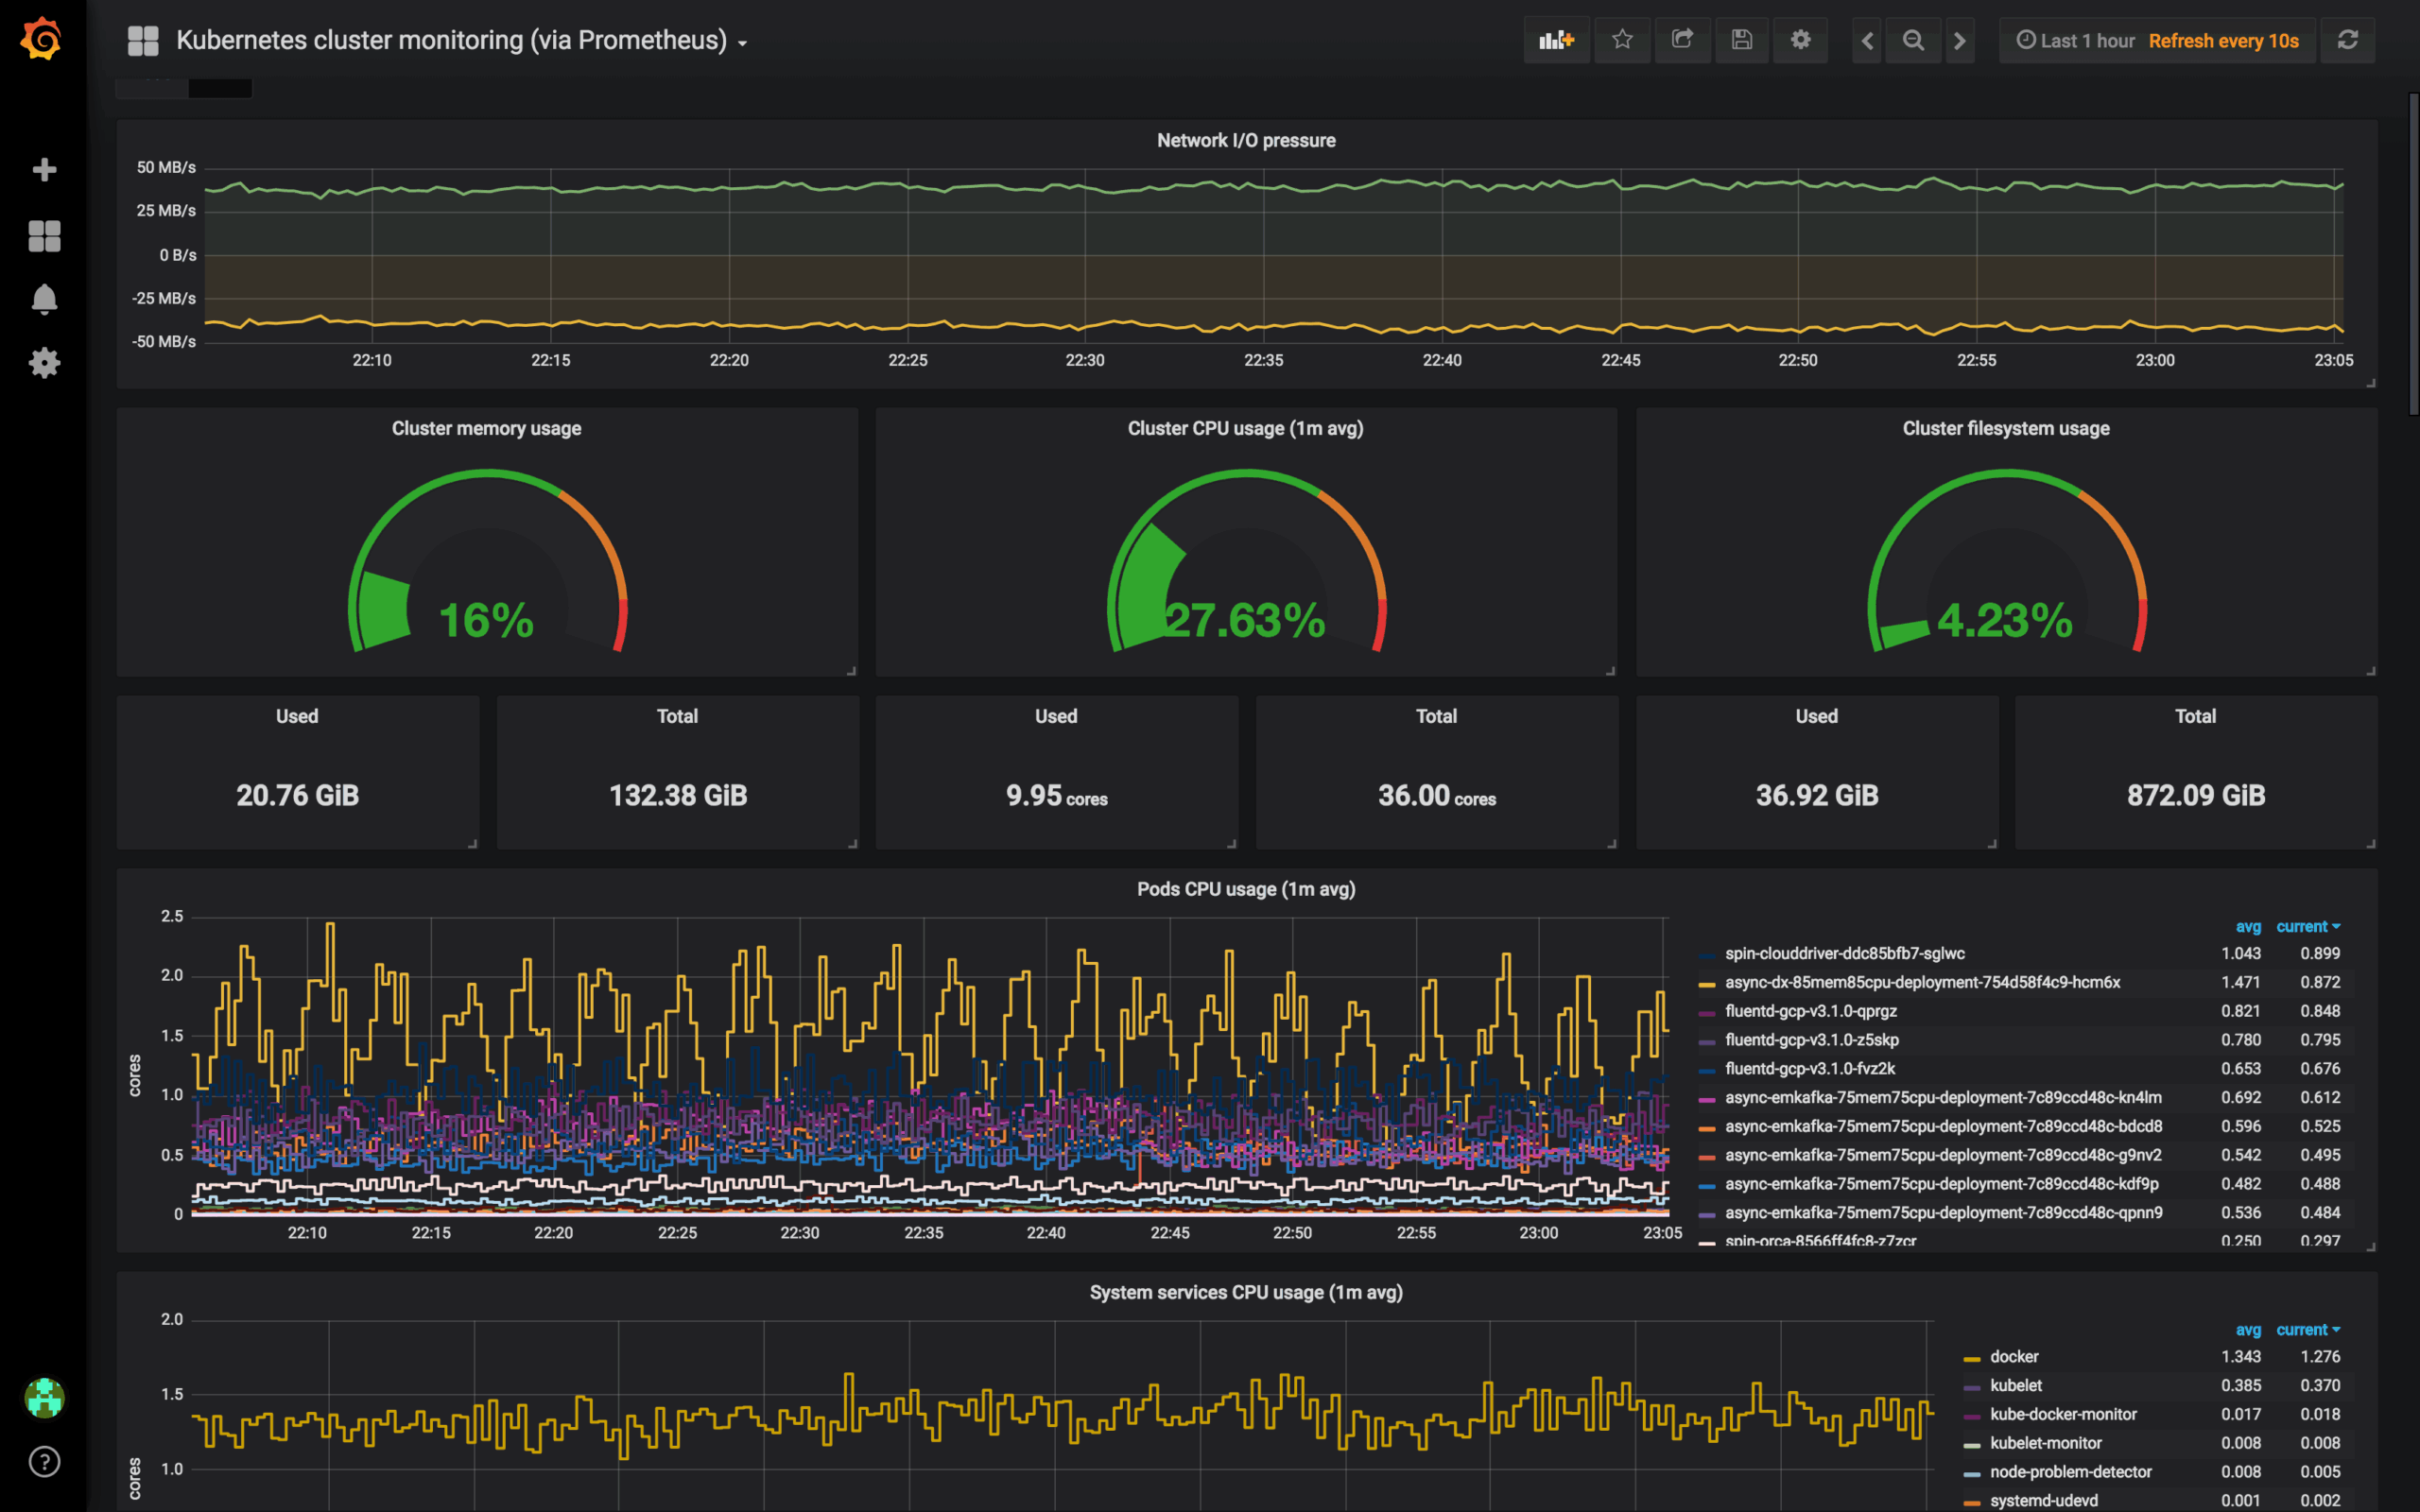
Image Courtesy: gcore
Prometheus and Grafana complement each other beautifully:
- Prometheuscollects, stores, and makes metrics queryable.
- Grafanaturns those raw metrics into meaningful, interactive visualizations and dashboards.
- Grafana treats Prometheus as a data source: you point Grafana at a Prometheus endpoint, and you can build panels based on PromQL queries.
- Grafana also lets you attach alertsto panels (in many cases), layering user-facing alerting on top of Prometheus rules.
- Over time, many teams expand the stack (logs, traces, profiling), but metrics (via Prometheus) and dashboards (via Grafana) often remain at the core.
Because of this synergy, the combination is widely adopted in cloud-native, microservices, DevOps, and infrastructure monitoring spaces.
Use Cases & Problem Statements Solved by Prometheus + Grafana
To make this concrete, let’s look at the kinds of problems this stack helps you solve.
Use Case A: Kubernetes / Container/Cloud Infrastructure Monitoring
Problem:Your cluster has dozens (or hundreds) of nodes, pods, services. CPU, memory, network usage vary over time. Without metrics, you’re flying blind.
Solution:Use node_exporter, cAdvisor, kube-state-metrics, and instrument your applications. Prometheus scrapes these metrics, Grafana presents dashboards to help you:
- Spot resource bottlenecks (CPU spikes, memory leaks)
- Monitor pod restarts, failed deployments, cluster events
- Visualize service dependencies and latency across namespaces
- Alert on thresholds (e.g. “if CPU usage > 90% for 5 minutes, notify ops”)
This is one of the most common real-world use cases.
Use Case B: Application Performance Monitoring (APM) / Endpoint Metrics
Problem:Your web application is slow, users complain. Which endpoints are causing delays? What’s the request load pattern?
Solution:Instrument your code (HTTP handlers, DB queries, business logic) to expose metrics like request latency, error rate, throughput. Prometheus collects those, and Grafana helps you:
- Visualize response time percentiles (p50, p95, p99)
- Compare endpoints by error rates, traffic volume
- Explore patterns over time and spot anomalies or trends
Use Case C: Alerting & Anomaly Detection
Problem:You don’t want to manually watch dashboards. You want to be notified when something deviates from normal.
Solution:Define alerting rules in Prometheus: e.g. if error_rate > 5% for 10m, or if disk usage > 85%. Alerts get sent to Alertmanager, which deduplicates, silences, and routes to notification channels. Grafana can also surface alerts (and embed them in dashboards).
You can also build anomaly detection dashboards (e.g. detect “traffic drop vs baseline”) by using advanced PromQL/transformations.
Use Case D: Business/Domain-Specific Metrics & SLIs
Problem:You want visibility not just at system level, but at business-level metrics: orders processed per minute, throughput in payments microservice, user signups, conversion rate.
Solution:Instrument your business logic to expose custom metrics. Use Prometheus to collect and Grafana to visualize these alongside infrastructure metrics. Now you have “observability” across technical and business signals in one place.
Use Case E: Edge / IoT / Remote Device Monitoring
Problem:You have many remote sensors, devices, or industrial systems in the field. You need to monitor their health (latency, errors, connectivity) in real-time.
Solution:Devices export metrics (or use push gateways) to Prometheus (or intermediate proxies). Grafana dashboards aggregate and present status maps, trend graphs, alerting on offline devices.
In fact, there are creative dashboards (e.g. monitoring bird songs, or chores!) in the Grafana community.
Pros of Prometheus and Grafana
- Open Source & Widely Adopted
Prometheus is a graduated CNCF project. Grafana is mature and further supports many data sources. Their popularity ensures community support, integrations, and longevity. - Rich Query Language & Dimensional Model
PromQL gives you expressive power to slice, filter, join, aggregate. The label-based model allows high-dimensional metrics queries. - Flexible & Extensible Dashboards
Grafana’s plugin ecosystem, templating, variables, drilldowns, annotations make dashboards highly dynamic and reusable. - Alerting & Automation
Prometheus → Alertmanager → Grafana → notifications create full alert pipelines. - Scalable for Many Use Cases
For many teams, Prometheus + Grafana scales well. Additional projects (e.g. Thanos, Cortex, Mimir) help when you hit large-scale demands. - Separation of Concerns
Clear separation: data collection/alerting (Prometheus) vs visualization (Grafana). You can change dashboards without touching metric collection pipelines. - Community & Ecosystem
Many exporters, integrations, dashboards, and community-contributed plugins exist already. Grafana’s community dashboard repository is rich.
Challengesof Prometheus and Grafana
- Storage & Scaling Limits
Prometheus is designed for single-node operation with local storage. For high scale (many metrics, long retention, high cardinality), you often need external systems (Thanos, Cortex, or Mimir). - High Cardinality / Label Explosion
With many labels, combinations, dynamic tags, you risk expensive queries or performance issues. - Learning Curve (PromQL, Dashboard Design)
PromQL is powerful but not trivial. Crafting good dashboards takes time and domain insight. - Operational Overhead
You must maintain, upgrade, back up Prometheus, Grafana, Alertmanager, manage data retention, rule files, etc. - Alert Fatigue & Noise
Poorly designed alert rules cause noise. Requires tuning, silences, alert grouping, filtering logic. - Version & Compatibility Challenges
Major upgrades sometimes break dashboards or plugin compatibility. (E.g. Grafana removed AngularJS support in version 11, which affected older dashboards) - Visibility Gaps in Logs/Traces
Prometheus + Grafana handles metrics well, but lacks native log or full trace context (though Grafana ecosystem extends into those).
Alternatives of Prometheus + Grafana
In some scenarios, other tools or combinations make sense:
- Metric-focused alternatives: InfluxDB + Telegraf + Chronograf (TICK stack), OpenTSDB, Graphite. These may offer stronger native storage or easier scaling in certain contexts.
- Managed / Commercial solutions: Datadog, New Relic, Dynatrace, Splunk Observability — they bundle metrics, logs, traces, dashboards, alerting out of the box, with vendor support.
- Full Observability Platforms: Elastic Stack (Elasticsearch + Kibana), Grafana + Loki + Tempo (Grafana’s observability triad), OpenTelemetry.
- Serverless / Cloud-native metric services: AWS CloudWatch, Azure Monitor, Google Cloud Monitoring — good for native cloud apps but may lack custom dimension flexibility or cost control.
- Hybrid / Middleware tools: Tools like Grafana Mimir (as Prometheus-compatible scalable storage) or embedding a metrics layer before visualization.
When choosing alternatives, weigh your scale needs, cost tolerance, flexibility, vendor lock-in, and how well metrics + dashboarding integrate.
Upcoming Updates, Trends, and Industry Insightsof Prometheus + Grafana
Since observability is fast-moving, let’s highlight what’s happening now (and what’s coming).
Recent & Upcoming Features in Grafana
- Grafana 12.1: Introduced automated health checks, streamlined alert views, improved visualizations, and more.
- Query / dashboard enhancements: Improvements to SQL expressions, custom variables, better UI for alerting, trendlines, enhanced visual components.
- Breaking changes management: From v12 onward, Grafana no longer maintains a separate “breaking changes” page; changes are integrated into release notes and “What’s New.”
- Internationalization of plugins & UI translations: Grafana is enabling plugins to support multiple languages.
- Scaling & storage enhancements: The Grafana Labs ecosystem continues to invest in projects like Mimir(metric store) to scale Prometheus workloads.
Research & Innovation Trends
- Approximation-first queries (PromSketch): A recent research project, PromSketch, proposes using sketch-based precomputations to reduce query latency for rule-based queries by orders of magnitude, making Prometheus more efficient for large-scale use.
- Integrated observability stacks: Tools increasingly combine metrics, logs, traces, and profiling (e.g. Grafana’s Tempo, Loki, Pyroscope).
- AI / ML in observability: Automated anomaly detection, root cause suggestion, auto-baselining based on historical metric patterns.
- Edge / IoT observability: More adoption of Prometheus + Grafana in distributed remote systems or edge devices, often with proxy collectors or push gateways.
- Cross-team / domain observability: Bringing business metrics (SLIs, revenue, conversion) into the same dashboard view as technical metrics, enabling unified context.
- Serverless and event-driven metric models: As serverless gains, observability systems adapt to ephemeral metrics and dynamic infrastructure.
Industry Signals & Adoption
- The Grafana community annually highlights creative dashboards people build—from monitoring chores to steel defect rates.
- Prometheus remains a top choice for Kubernetes-native monitoring. Many cloud platforms (EKS, AKS, GKE) provide first-class integration.
- Observability budgets are growing: many organizations invest more in monitoring/alerting over next few years.
Project References of Prometheus + Grafana
Frequently Asked Questions of Prometheus + Grafana
Below are common doubts teams encounter when adopting this stack.
Q1. How do I decide scrape intervals?
Scrape too often: high load, many metrics, more churn. Scrape too infrequently: lose resolution. A typical default is 15s or 30s for infrastructure metrics; you may choose finer granularity for critical endpoints.
Q2. How do I handle metrics retention & historical data?
Prometheus by default stores local data (weeks to months, depending on disk). For longer retention or federation, use Thanos, Cortex, Mimir, or remote write to long-term stores.
Q3. How to avoid alert fatigue / noisy alerts?
Use thresholds aligned with SLOs, group related alerts, set minimum durations (e.g. “5 minutes above threshold”), use silence windows, and periodically review alerts.
Q4. How to upgrade Grafana & Prometheus safely?
Always back up dashboards, configurations, data. Check plugin compatibility. In Grafana 11, support for older AngularJS panels was removed—migrate before upgrading.
Q5. What about high cardinality / too many labels?
Be careful with dynamic labels (e.g. user_id, session_id). Use lower-cardinality labels for metrics used in aggregations, and reserve high-cardinality metrics only for edge debugging.
Q6. Can Grafana trigger more complex actions than alerts?
Grafana supports transformations, data links, drilldowns, and in some versions, alerting panels. But deeper automation (self-healing, auto scaling) usually resides outside, triggered by alert notifications.
Q7. Where do logs / traces fit?
Prometheus + Grafana are primarily for metrics. For logs, you can add Loki(Grafana’s log aggregator) or other log systems; for traces, use Tempo, Jaeger, or OpenTelemetry. Integration into unified dashboards lets you jump from an alert straight into logs/traces.
Third Eye Data’s Take on Prometheus, Grafana
At Third EyeData, we use Prometheusas our metrics engine to monitorAI model performance, service health, latency, throughput, and system resource usage. It helps us build observability into productionAI pipelines, enabling proactive alerting and troubleshooting. Prometheus is a key part of our production telemetry stack, especially formission-critical systems like predictive maintenance.
We integrate Grafanaat Third EyeData as our dashboarding layer for live metrics, alerts, and performance visualization. We expose model-level, service-level, and infrastructure-level metrics via Grafana dashboards to clients and internal teams for transparency, operational insight, and accountability. It forms a crucial feedback loop in our DevOps / MLOpsarchitecture.
Observability is shifting from reactive to proactive — we want systems that tell us why, not just thatsomething broke. Prometheus and Grafana provide a powerful foundation for that shift: metrics collection, querying, visualization, alerting — all in your control.
From my experience:
- Start small: pick a high-impact service or component, instrument it, get dashboards running.
- Use templated dashboards and variables for reuse.
- Iterate on alerts based on what’s useful (not what’s “cool”).
- Version your dashboards and configs alongside your infrastructure code.
- Combine technical metrics with business metrics to build shared understanding across engineering, product, operations.
Call to Action (CTA):
If you’re ready to get your hands dirty:
- Set up Prometheus + Grafanain a sandbox (Docker, Kubernetes, or VM).
- Instrumenta simple service (e.g. HTTP endpoint, database) to expose metrics.
- Build a basic dashboardin Grafana with latency, throughput, error rate.
- Define a few alert rules(e.g. CPU spike, high error rate).
- Share the dashboards with your team, learn from feedback, expand metrics.