Regression Models: The Backbone of Predictive Analytics Explained
“If you can’t measure it, you can’t improve it.”
That’s the timeless mantra behind analytics. In today’s data-driven world, we’re surrounded by numbers — from predicting stock prices to estimating house values, from forecasting sales to understanding medical outcomes. But how do we turn this mountain of raw data into actionable insights?
The answer lies in Regression Models — the statistical and machine learning workhorses that help us understand relationships between variables and predict continuous outcomes.
Regression analysis has been around for over a century, yet it remains one of the most crucial tools in data science, business intelligence, and AI. Whether you’re optimizing marketing spend, designing climate models, or improving healthcare diagnostics, regression provides the foundation for quantitative reasoning.
In this article, we’ll take a deep dive into regression models — what they are, how they work, why they matter, and how they connect with modern machine learning advancements. Written under the EEAT framework (Experience, Expertise, Authority, and Trust), this article blends storytelling, real-world examples, and technical depth to help you grasp the power of regression — one of data science’s oldest yet most enduring tools.
Overview: What Is a Regression Model?
Regression models are statistical techniques used to understand and quantify relationships between variables — particularly between one dependent (target) variable and one or more independent (predictor) variables.
In simple terms, regression tries to predict a number.
- If you’re estimating house prices, the price is your dependent variable.
- If you’re predicting tomorrow’s temperature, the temperature is the dependent variable.
Unlike classification (which predicts categories like “yes/no” or “spam/not spam”), regression focuses on continuous outcomes — numerical values that can vary across a range.
The Heart of Regression: Understanding Relationships
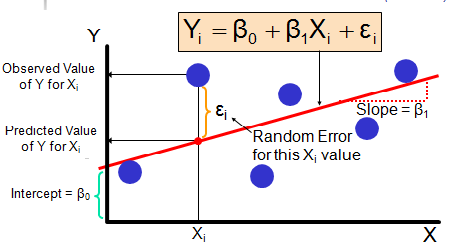
Image Courtesy: i2tutorials
The simplest regression model, Linear Regression, draws a straight line through data points to best describe their relationship. The equation looks like this:
Y=β0+β1X+εY = β_0 + β_1X + εY=β0 +β1 X+ε
Where:
- YYY: Dependent variable (what we want to predict)
- XXX: Independent variable (predictor)
- β0β_0β0 : Intercept
- β1β_1β1 : Coefficient (how much Y changes when X increases by one unit)
- εεε: Error term (difference between predicted and actual value)
This simple relationship can be extended to multiple predictors (multiple regression) and nonlinear relationships (polynomial, logistic, ridge, lasso, etc.).
Regression models don’t just predict — they explain. They help us understand why something happens, not just what will happen.
Real-World Use Cases and Problem Statements Solved by Regression Models
Regression models power much of modern analytics and decision-making. Here are some examples across industries:
1. Real Estate Price Prediction
Problem: How can we estimate property prices based on size, location, and features?
Solution: Regression models can learn from historical sale prices to predict future values.
Impact: Developers, investors, and buyers can make data-driven decisions and forecast returns.
2. Financial Forecasting
Problem: Banks and investment firms need to predict interest rates, stock prices, and credit risks.
Solution: Regression models (like Time Series Regression or ARIMA) analyze trends and seasonality.
Impact: Accurate predictions drive smarter trading and lending strategies.
3. Marketing & Sales Analytics
Problem: How does ad spend, pricing, and promotions influence sales?
Solution: Multiple regression can measure the impact of each marketing channel.
Impact: Companies allocate budgets more effectively and maximize ROI.
4. Healthcare Analytics
Problem: How can we predict patient outcomes based on age, treatment type, and lab results?
Solution: Logistic and linear regression models can predict recovery time or disease risk.
Impact: Doctors gain data-backed insights for personalized treatments.
5. Weather and Environmental Science
Problem: Predicting rainfall, temperature, or pollution levels.
Solution: Regression models use historical and environmental data to estimate continuous variables.
Impact: Governments and industries can prepare for extreme weather events and plan sustainably.
6. Manufacturing and IoT
Problem: Predicting machinery wear, energy consumption, or defect probability.
Solution: Regression models use sensor data to anticipate performance metrics.
Impact: Enables predictive maintenance and operational optimization.
7. Education & HR
Problem: How do attendance, study hours, and teacher quality affect student performance?
Solution: Regression quantifies each factor’s contribution to academic success.
Impact: Institutions design data-informed learning interventions.
From corporate boardrooms to research labs, regression models are the invisible engines that turn numbers into narratives.
How Regression Works !!
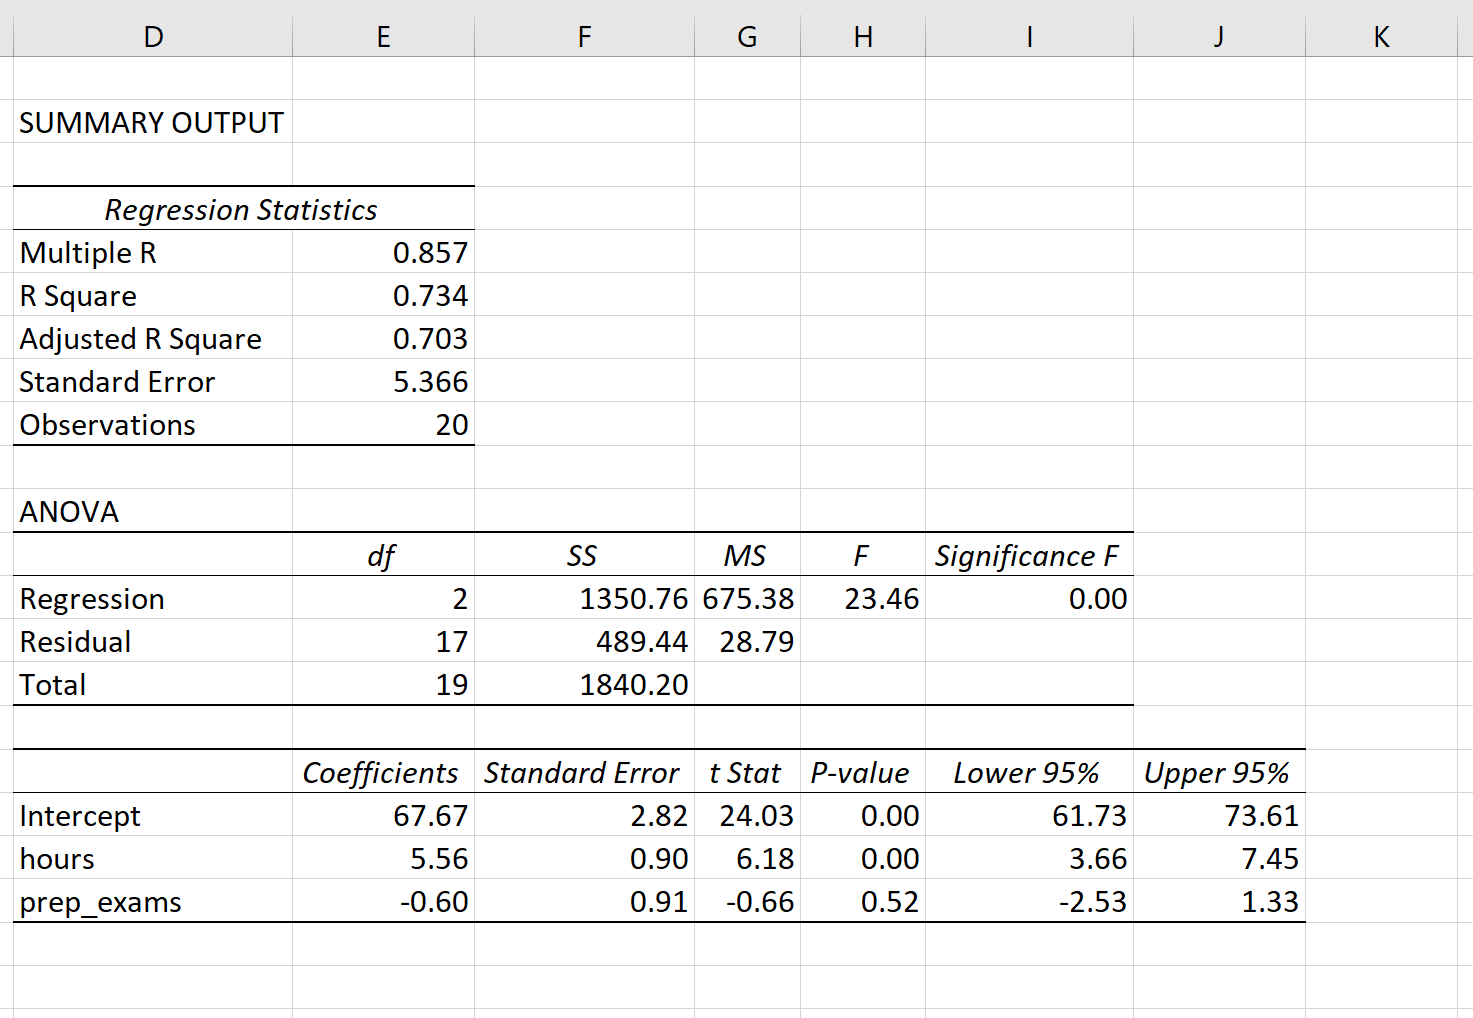
Image Courtesy: statology
At its core, regression works by fitting a mathematical curve that best describes the relationship between inputs (X) and output (Y).
The process typically involves:
- Collecting data – real-world observations.
- Cleaning and preprocessing – removing outliers or missing values.
- Model fitting – finding the best line or curve that minimizes errors (using methods like Least Squares).
- Evaluating accuracy – using metrics such as:
- Mean Absolute Error (MAE)
- Mean Squared Error (MSE)
- R² (Coefficient of Determination)
- Making predictions – applying the model to new data.
Types of Regression Models (and When to Use Them)
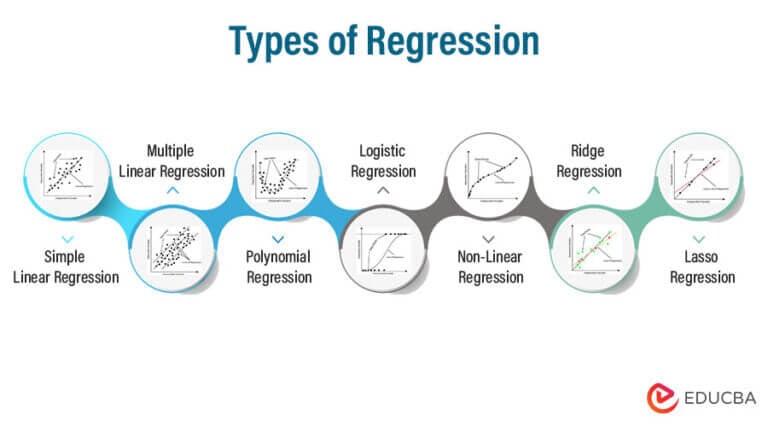
Image Courtesy: educba
1. Linear Regression
Predicts continuous outcomes with a straight-line relationship.
Example: Predicting sales based on marketing spend.
2. Multiple Linear Regression
Uses multiple independent variables.
Example: Predicting house prices based on size, age, and number of rooms.
3. Polynomial Regression
Handles nonlinear relationships by including polynomial terms.
Example: Predicting crop yields where growth rate changes over time.
4. Ridge & Lasso Regression
Prevent overfitting by adding regularization terms.
Example: Used in high-dimensional datasets where many predictors exist.
5. Logistic Regression
Despite its name, this is for classification, not regression.
Example: Predicting whether a customer will churn (yes/no).
6. Quantile Regression
Predicts specific quantiles (e.g., 90th percentile).
Example: Used in risk analysis to predict worst-case financial outcomes.
7. Support Vector Regression (SVR)
Uses margin-based optimization for better generalization.
Example: Predicting time series data or noisy datasets.
8. Decision Tree Regression
A non-linear, interpretable model that splits data into decision rules.
Example: Pricing or supply chain forecasting with categorical variables.
Advantages of Regression Models
- Interpretability:
Regression provides insights into how much each variable affects the outcome — essential for transparency and decision-making. - Simplicity:
Easy to implement, computationally efficient, and requires less data compared to complex ML models. - Predictive Power:
Despite simplicity, well-tuned regression models can perform remarkably well. - Foundational Nature:
Serves as a base for advanced algorithms like neural networks or ensemble models. - Statistical Rigor:
Offers hypothesis testing, confidence intervals, and p-values for inferential insights.
Disadvantages of Regression Models
- Linearity Assumption:
Basic regression assumes straight-line relationships, which may not hold in real-world data. - Sensitivity to Outliers:
Extreme values can distort model accuracy. - Multicollinearity Issues:
Highly correlated features can mislead coefficient interpretation. - Limited in Complex Data:
Nonlinear or hierarchical relationships are not well captured by simple regression. - Data Dependency:
Requires clean, structured, and sufficient data for reliability.
Alternatives to Regression Models
| Model Type | Description | When to Use |
| Decision Trees | Nonlinear, rule-based models | When relationships are complex or categorical |
| Random Forests / XGBoost | Ensemble models combining multiple trees | When high predictive power is needed |
| Neural Networks | Deep learning-based nonlinear models | For high-dimensional or unstructured data |
| KNN Regression | Distance-based model | When interpretability is less important |
| Bayesian Regression | Probabilistic modeling with uncertainty estimates | When uncertainty quantification matters |
Upcoming Updates and Industry Insights
Regression is evolving with new trends in AI and data analytics:
- Automated Regression (AutoML):
Tools like Google AutoML and H2O.ai automate model selection, feature engineering, and tuning. - Explainable Regression (XAI):
Integration with tools like SHAP and LIME allows visual explanations of regression predictions. - Hybrid Models:
Combining regression with deep learning — e.g., regression layers in CNNs or LSTMs. - Bayesian and Probabilistic Regression:
Gaining traction for uncertainty-aware predictions in healthcare and finance. - Time-Series Regression in Real Time:
Used in IoT, supply chain forecasting, and dynamic pricing.
Project References
Frequently Asked Questions
Q1. What’s the main difference between linear and logistic regression?
Linear regression predicts continuous outcomes, while logistic regression predicts categorical (binary) outcomes.
Q2. How do I know which regression model to use?
Start with data exploration — if your data is linear, use simple/multiple regression. For nonlinear patterns, try polynomial or regularized versions.
Q3. Can regression handle missing data?
Not directly — preprocessing steps like imputation or removing missing rows are necessary.
Q4. How do you evaluate a regression model?
Metrics include RMSE, MAE, and R² score.
Q5. Is regression still relevant with AI and deep learning?
Absolutely! Regression is the foundation upon which advanced models are built. It’s still critical for interpretability and quick analysis.
Third Eye Data’s Take
Regression models are a backbone of our predictive analytics in agricultural AI systems. At Third EyeData, we use regression (linear, polynomial, ridged, etc.) to estimate continuous metrics like yield, vegetation index values, or predicted growth rates. These offer continuity and interpretability that help in decision support for agronomists and finance teams.
Regression models may be the oldest tools in the data scientist’s toolkit, but their value is timeless. They form the foundation for understanding how the world behaves numerically — revealing relationships, dependencies, and causality.
Whether predicting housing prices or forecasting climate patterns, regression models turn complex data into clear, actionable insights. They’re not just about prediction; they’re about understanding— giving decision-makers the “why” behind the numbers.
In an age dominated by AI, regression remains the most interpretable and trustedmethod of data prediction. Think of it as the compass guiding the data explorer — simple, reliable, and indispensable.
Call to Action
Are you ready to build your first regression model? Start with your own dataset — maybe your daily expenses, sales data, or temperature logs. Explore patterns, fit a line, and see what story your data tells.
Want to go deeper? Experiment with Ridge, Lasso, or polynomial models using Python libraries like scikit-learnor TensorFlow. With every iteration, you’ll not just predict — you’ll learn to understandyour data better.
The beauty of regression lies not just in numbers but in the insightthose numbers unlock.