Anatomy of a Streaming Data Engineering Pipeline
A real-time cybersecurity example using Apache Metron and Apache NiFi
Cybersecurity has become a big data problem; driven by the massive number of systems and applications that need to be monitored within an enterprise network, and the need to analyse and action against threats in real-time. Apache Metron is a real-time analytics framework for detecting cyber anomalies at scale, that is built on top of the open-source big data ecosystem. Although Metron focuses directly on Cybersecurity, its architecture and data engineering concepts are general purpose and applicable to many different real-time data use cases.
The scope of this article is to cover the anatomy of a streaming data engineering pipeline, with a look at Apache Metron as a real-world example of how one can be implemented. If you’re looking for information on how Metron can be used to power a Security Operations Centre, check out the Metron website here.
Elements that make up a streaming data engineering pipeline
Before we jump into the Metron framework, let’s take a step back and look at some general data engineering concepts.
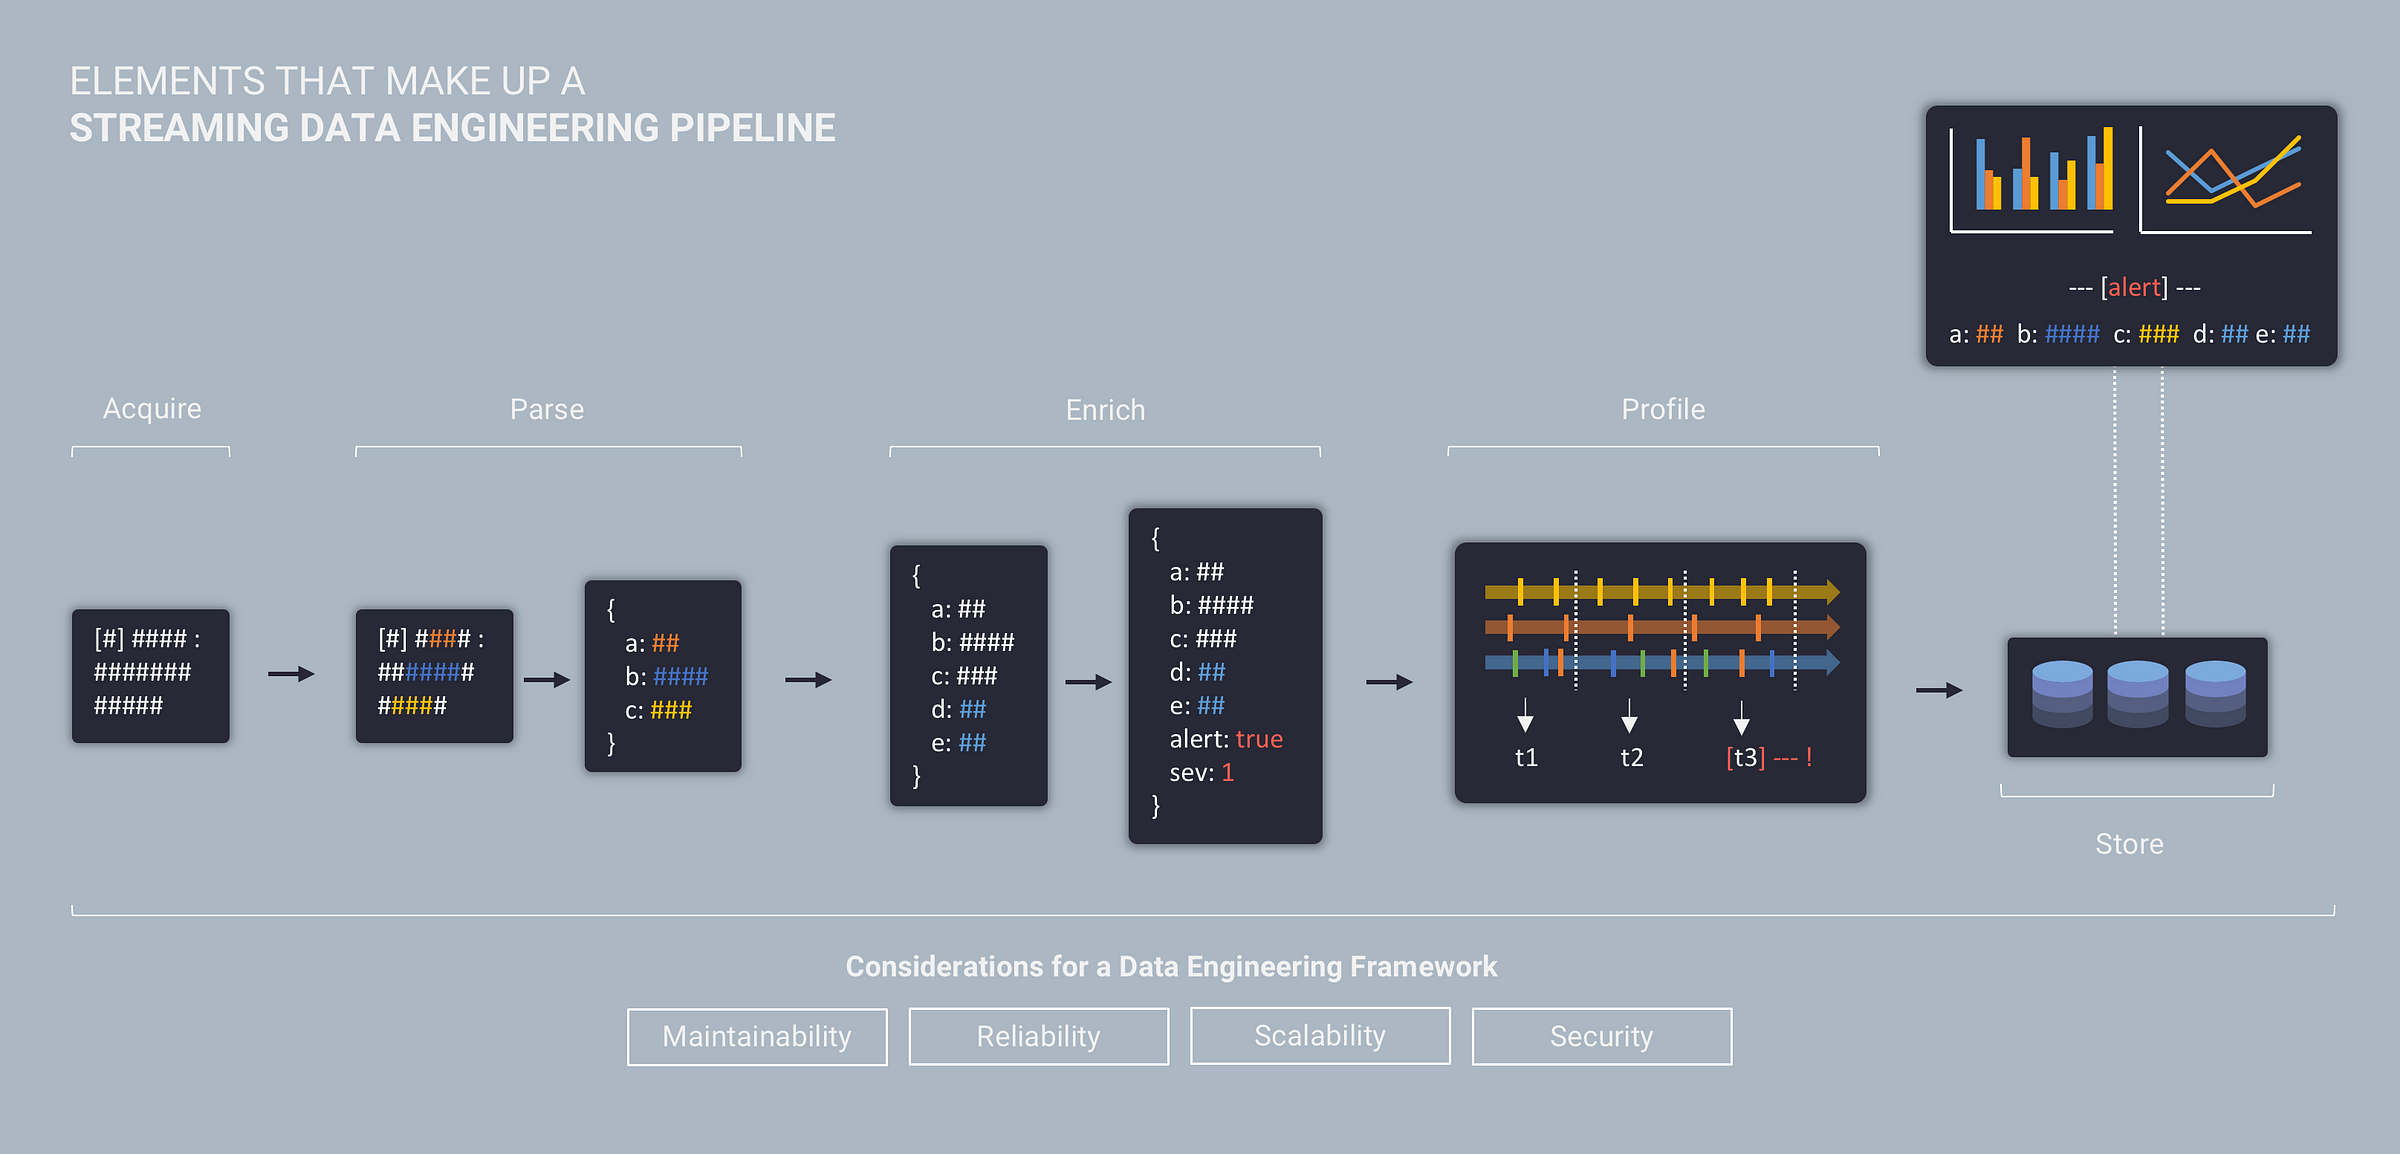
For real-time and streaming use cases, a data engineering pipeline is typically made up of the following five elements:
- Acquire – Acquire raw data from source systems
- Parse – Convert raw data into a common data model and format
- Enrich – Add additional context to the data
- Profile – Analyse entity behaviour across time (sessionisation)
- Store – Store data to support access and visualisation
While these elements represent the functional aspects of a streaming data system (and are the main focus of this article), building a production grade data pipeline also requires your data engineering efforts to align with the following characteristics:
- Maintainability – focus on automation, repeatability, & extensibility
- Reliability – focus on fault tolerance, monitoring, & data quality
- Scalability – focus on performance, volume, & the ability to handle growth
- Security – focus on authentication, authorization, audit, & encryption
Anatomy of the Metron Data Engineering Pipeline
To dive deeper into the functional concepts listed above, let’s examine the underlying architecture of the Metron data pipeline and step through each of the core functions.
The first thing to understand about Metron is that it is not a standalone “component” – think of it as a framework and application that is built on top ofother open source big data components. It leverages Apache Kafka as an event buffer, Apache Storm as a streams processing engine, Apache Solr as a random access storage layer, HDFS for long-term storage with Apache Spark for batch profiling and historical analytics:
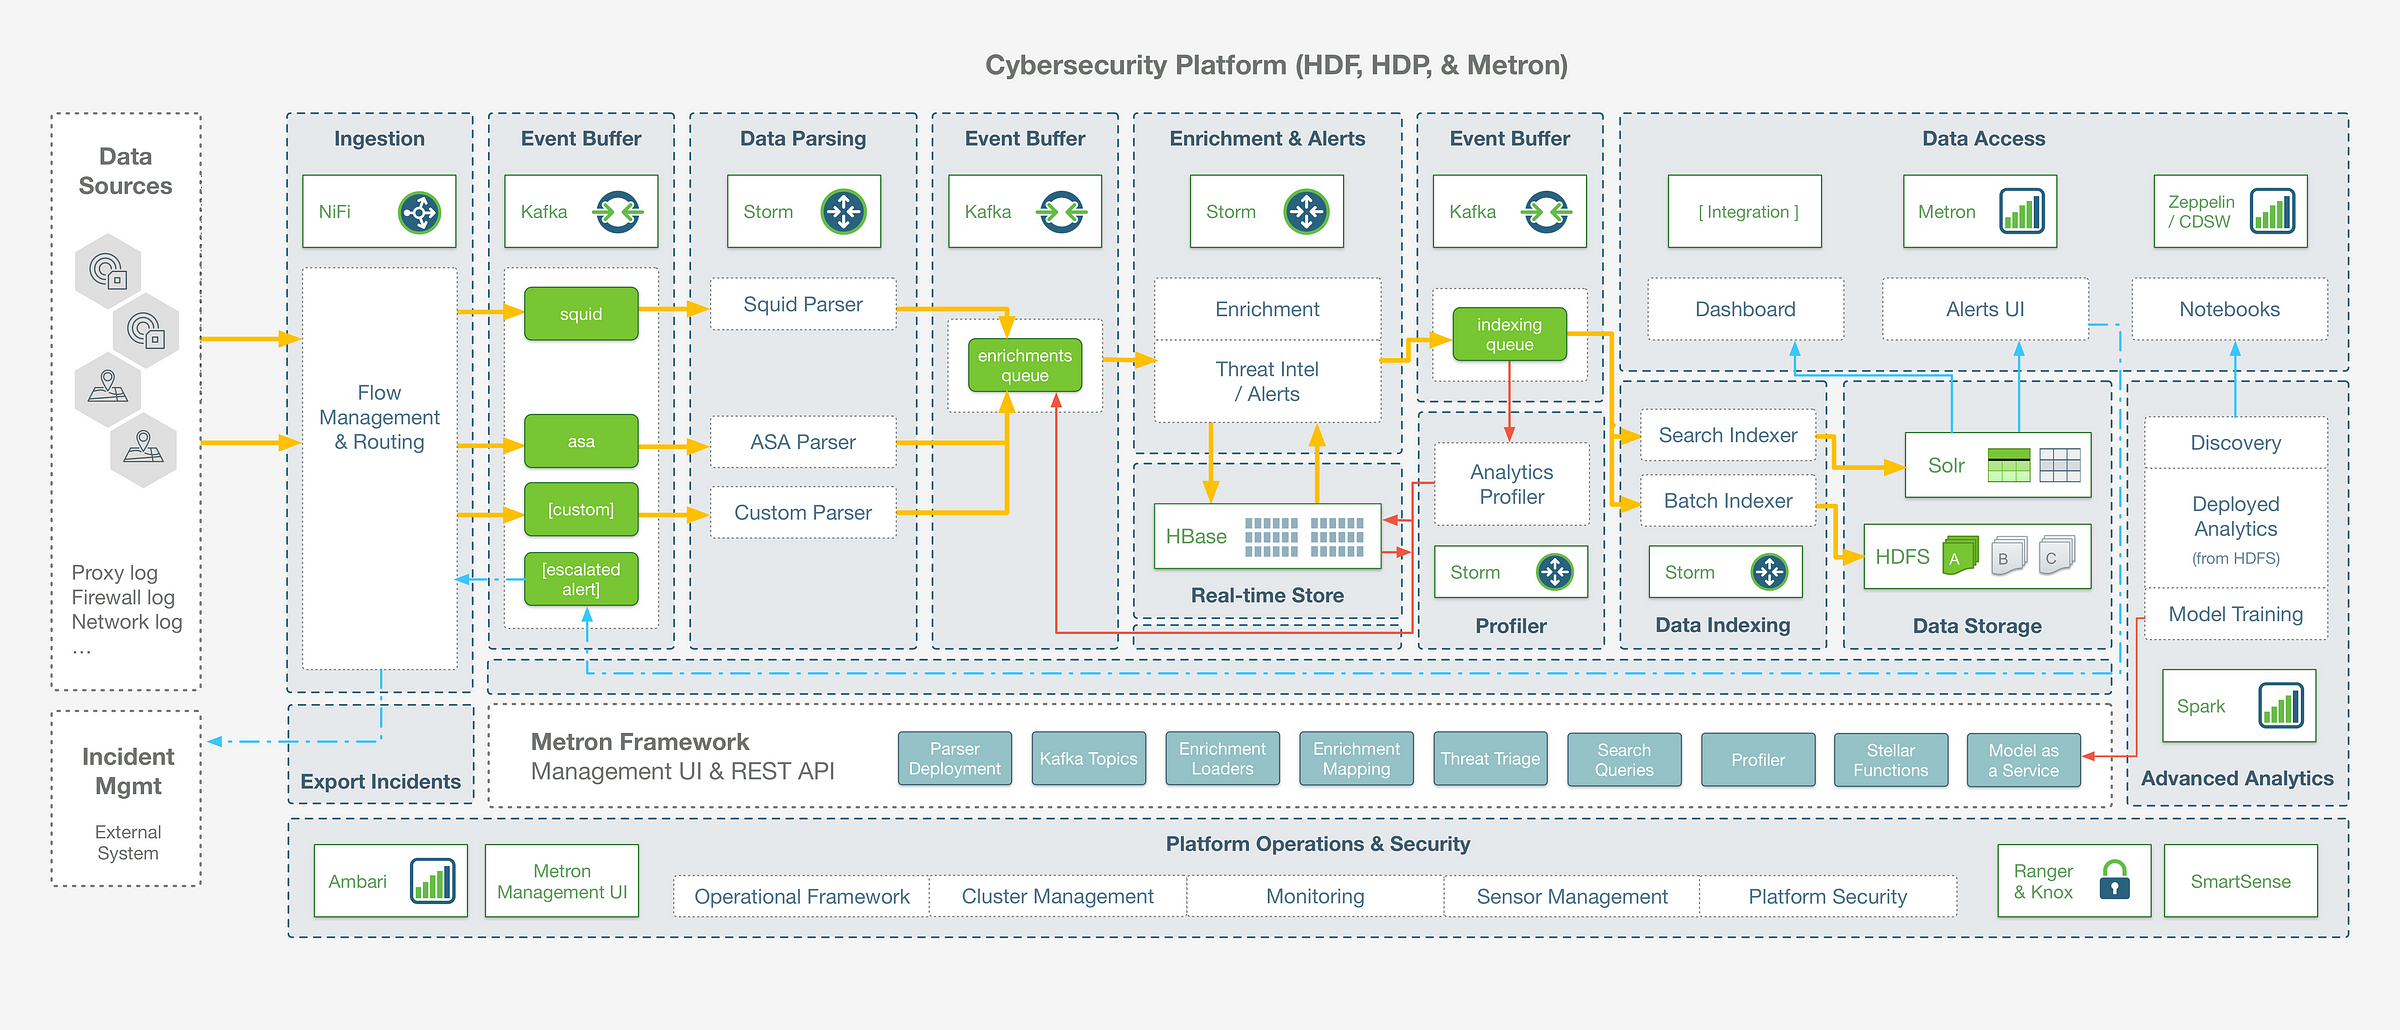
At a high level, it is worth noting that:
- Metron is a real-time solution, so the movement of data throughout this end to end data pipeline is happening in a sub-second stream
- The Metron framework provides a configuration driven abstraction which allows you to implement use case pipelines without writing any storm code directly
- The architecture is general purpose, and while the Metron framework is built on Storm as the underlying engine, there are other open source components that you could consider using if building your own framework from scratch (for example: Spark Streaming, Flink, or Kafka Streams – each with their own benefits and trade-offs depending on your use case)
Step 0: Acquire – getting data into Metron
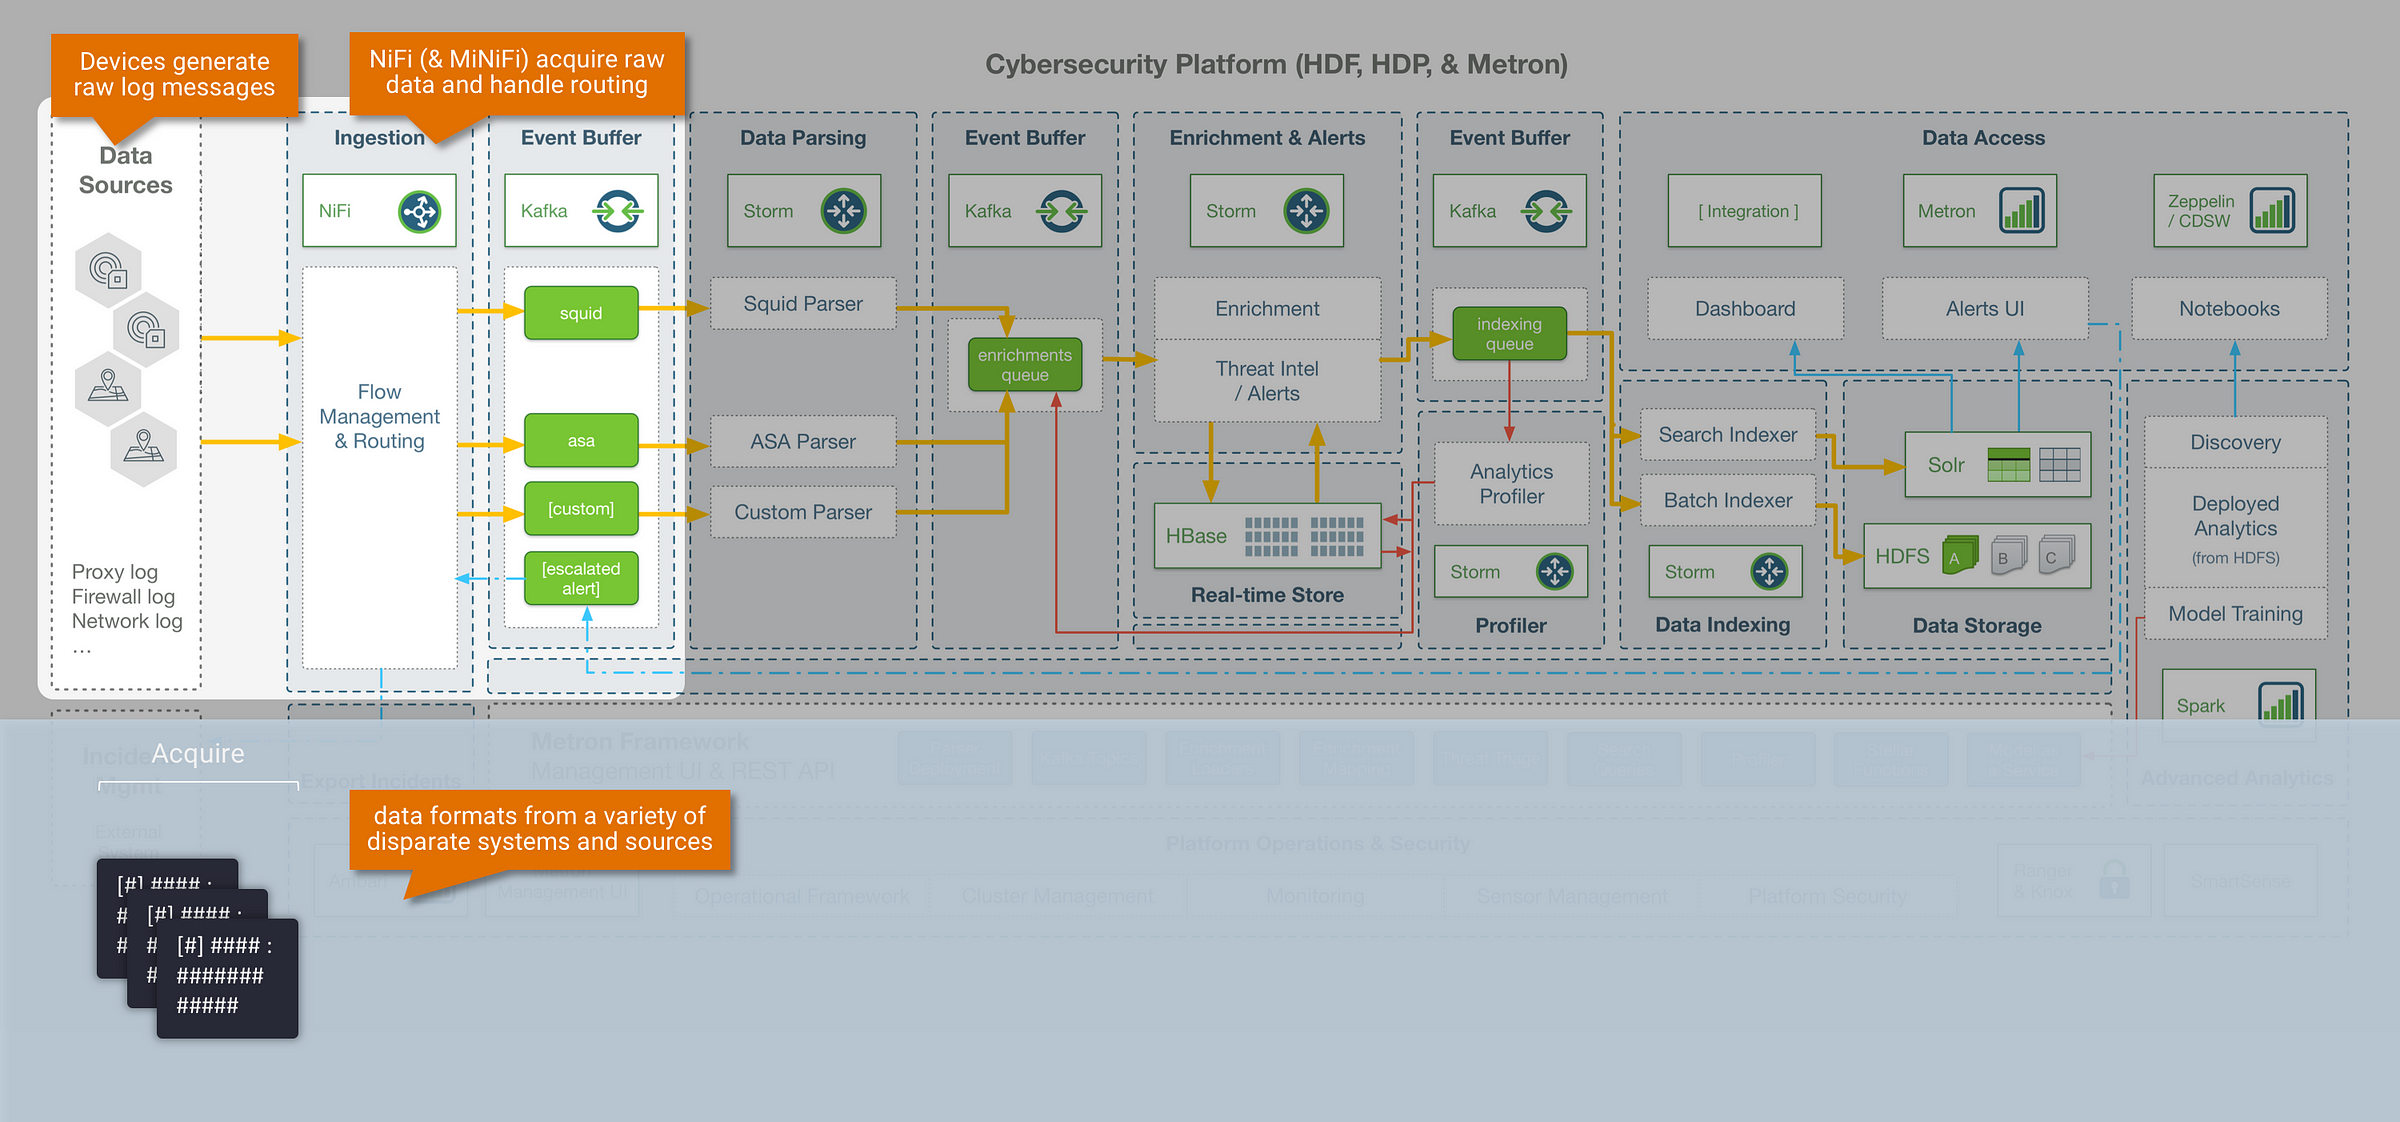
The entry point into the Metron framework is Apache Kafka, where raw device logs are sent to corresponding device topics (Kafka is used throughout the Metron pipeline as an intermediate event buffer). There are many different ways to stream data into Kafka, and in this example we leverage Apache NiFi for data collection and routing. NiFi is a good fit to accompany Metron, and in general a powerful tool for data engineers because:
- it is scalable, and nicely handles many of the complexities that come with dataflow management (back-pressure, dynamic prioritisation, data provenance etc)
- it is UI driven and easy to use, but also provides mechanisms to operationally scale deployments without the UI (i.e, dynamic flow routing based on metadata attributes, and workflow version control for templated deployments using NiFi Registry)
- MiNiFi extends data collection and processing to edge devices for IoT use cases
- NiFi ships with 300+ out-of-the-box processors and connectors, and is extendable if custom integrations are required
Step 1: Parsing
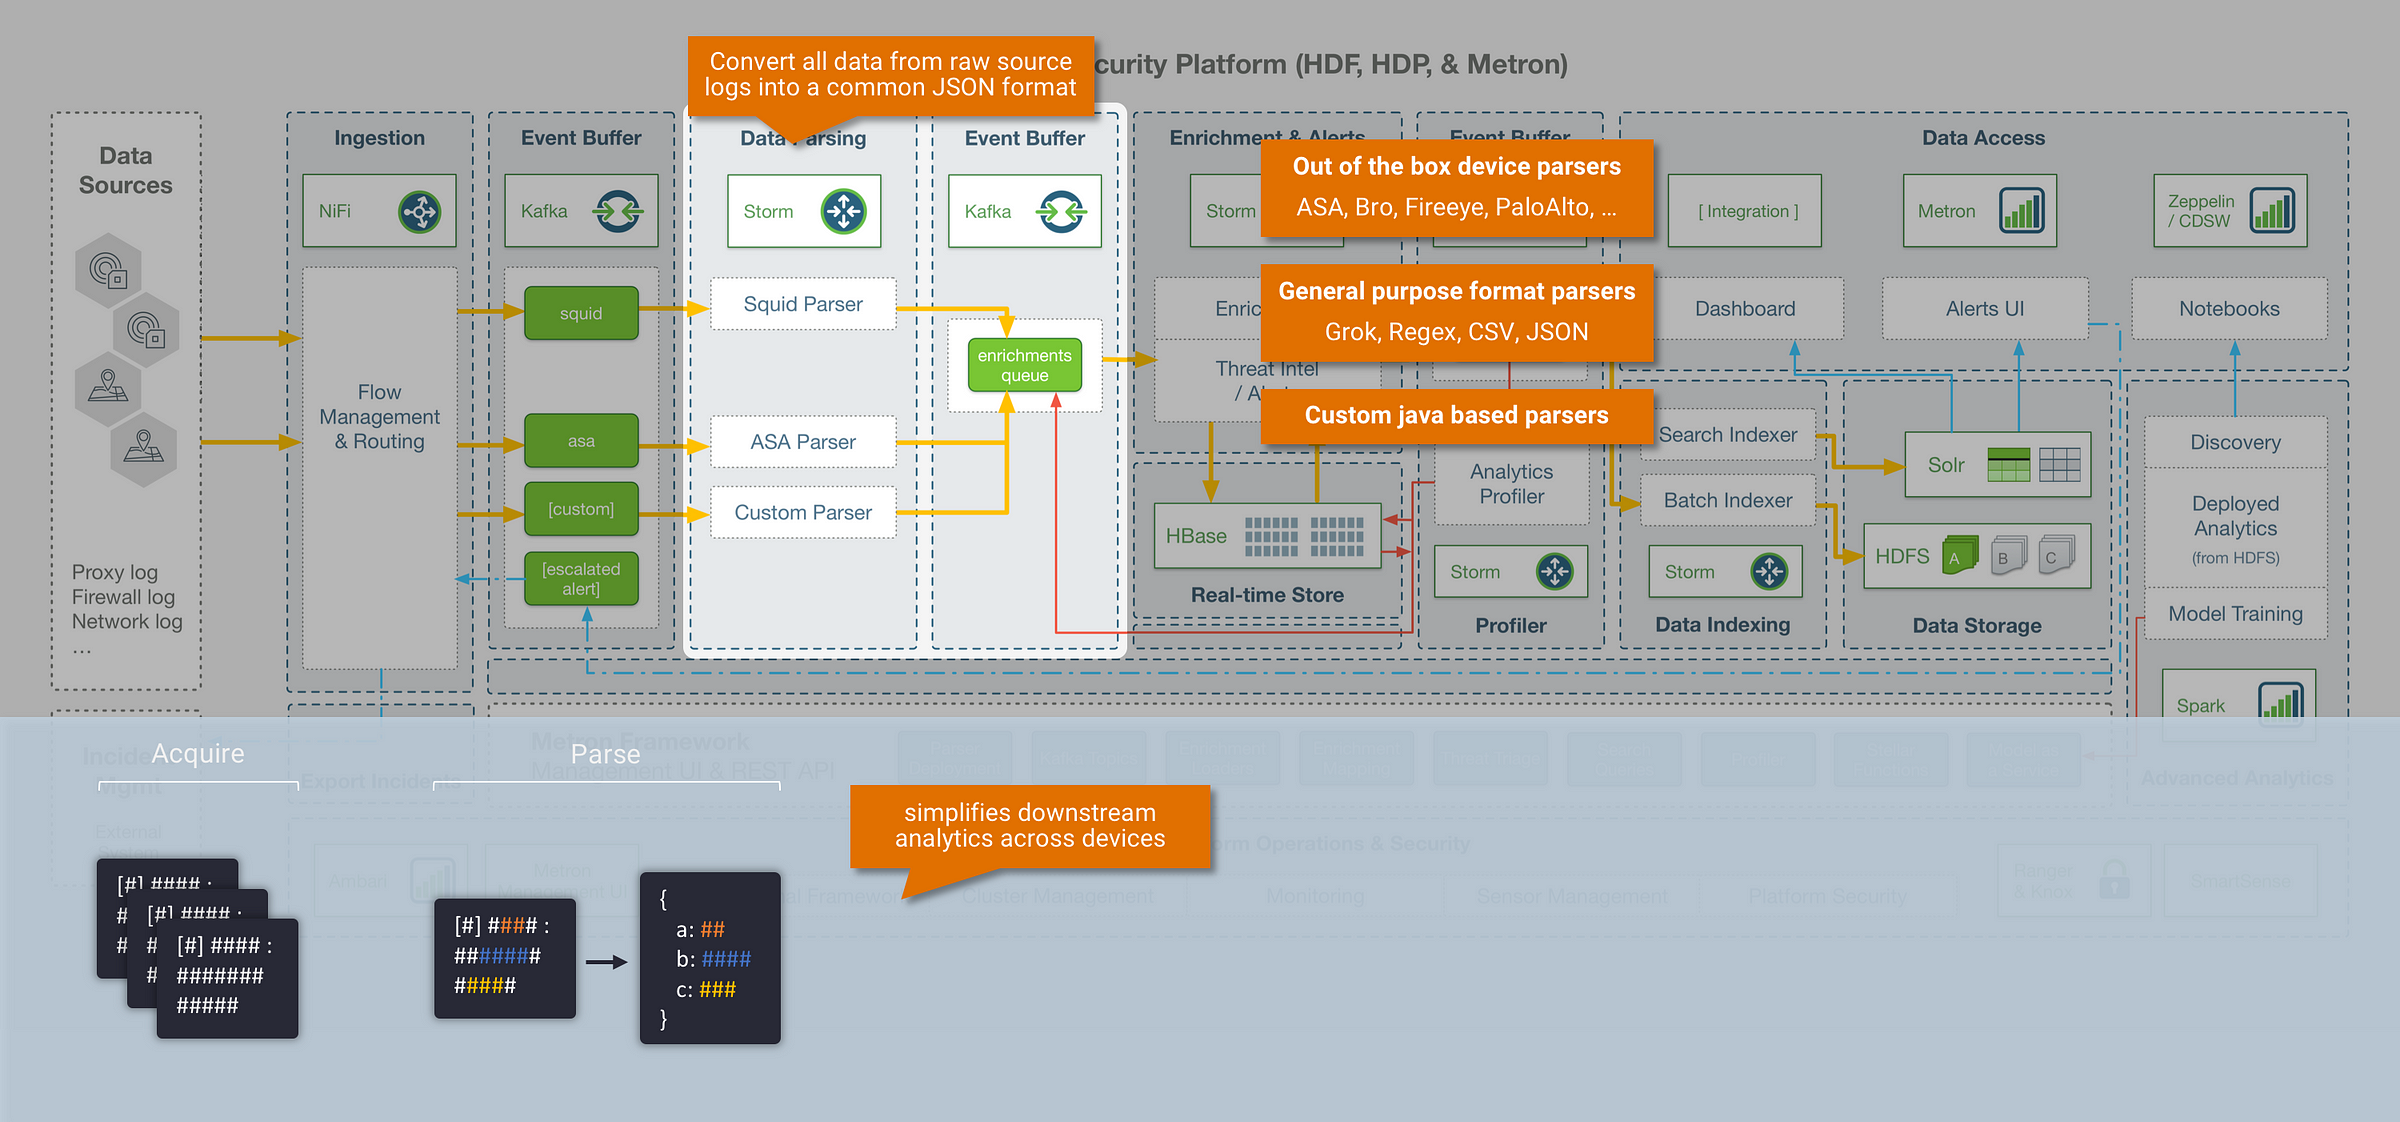
The first step within the Metron data pipeline is to parse the incoming data into a common data format. In any real-world scenario, you are almost always collecting data events from a large variety of disparate systems and sources, which results in the ingestion of multiple data formats (freeform log lines, csv, json, etc..) and multiple data models (varying fields and definitions). The goal of the parsing stage is to convert all these source system raw logs into a common format and data model, in order to simplify our ability to analyse this data downstream. Metron parses data into JSON format, and allows any data model to be used. Within the Metron framework the following options are available to handle parsing:
Leverage a common device parser (config driven)
- Metron today ships with some out of the box log parsers for common device types (including parsers for Cisco ASA, FireEye, ISE, CEF, Lancope, PaloAlto, Snort, Sourcefire.. etc)
Leverage a general purpose format parser (config driven):
- Metron also ships with general purpose format parsers, that can be configured for specific use cases (supporting Grok, Regex, CSV, JSON)
Build a custom parser (java based):
- The Metron parser framework is extendable, which means for cases that can’t be covered with the config driven parsers, the option to create a custom Java parser is available
Step 2: Enrichment
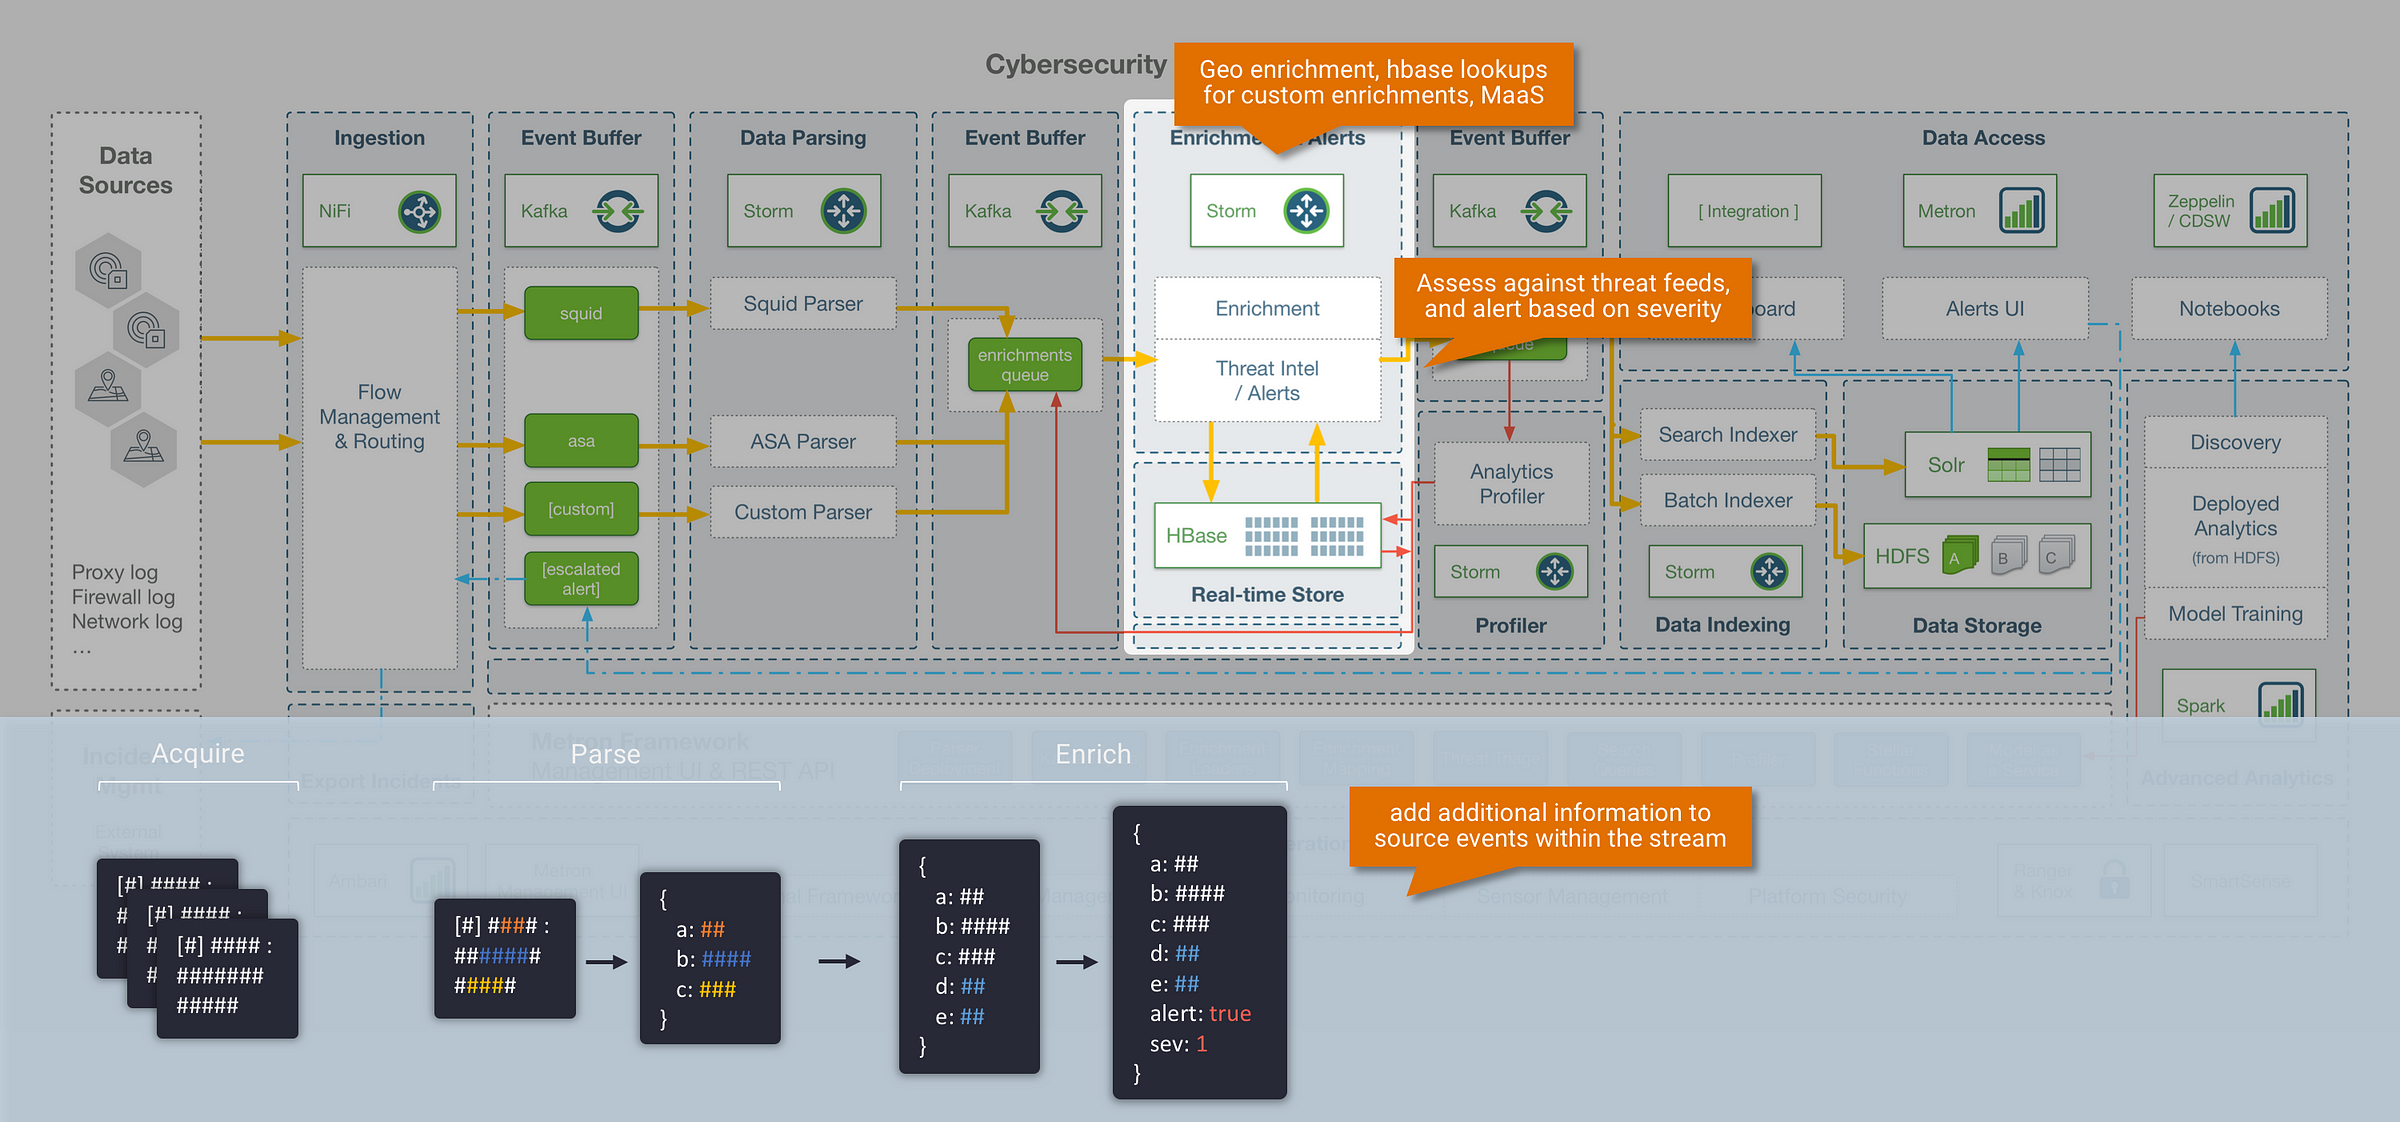
Context is critical in cybersecurity use cases, and the ability to add context to our data brings us closer to having a ‘single pane of glass’ interface. Metron provides an enrichment framework for updating streaming events with data from external sources. This opens up the following capability:
#1: Enrichment Lookups
- The ability to enrich messages with data from an external data store (e.g, HBase), based on a lookup field within the streaming message (an example of this includes a GeoIP lookup, where location info is added into a streaming message based on a provided IP Address)
- The Metron enrichment store within HBase also supports both batch and streaming updates, which means it works with use cases where the lookup data itself may be changing frequently (for example, an IP to Hostname mapping table)
#2: Detection Rules & Threat Triage
- The ability to label messages as threat alerts by assessing them against known threat feeds, triage the severity of a threat, and associate it with a numeric severity rating
- Metron also ships with an extendable Domain Specific Language (DSL) called Stellar that gives security analysts a method of creating detection rules without writing any custom code
#3: Model as a Service (MaaS)
- In addition to standard lookups, Metron provides the ability to enrich messages with data derived from machine learning or statistical models. The Metron MaaS infrastructure deploys trained models (that could be in python, R, scala) as distributed REST endpoints on YARN, in which the streaming messages can be enriched against.
- An example of this could be a model that attempts to predict if the website being visited is malicious based on the name of the website
Step 3: Profiling
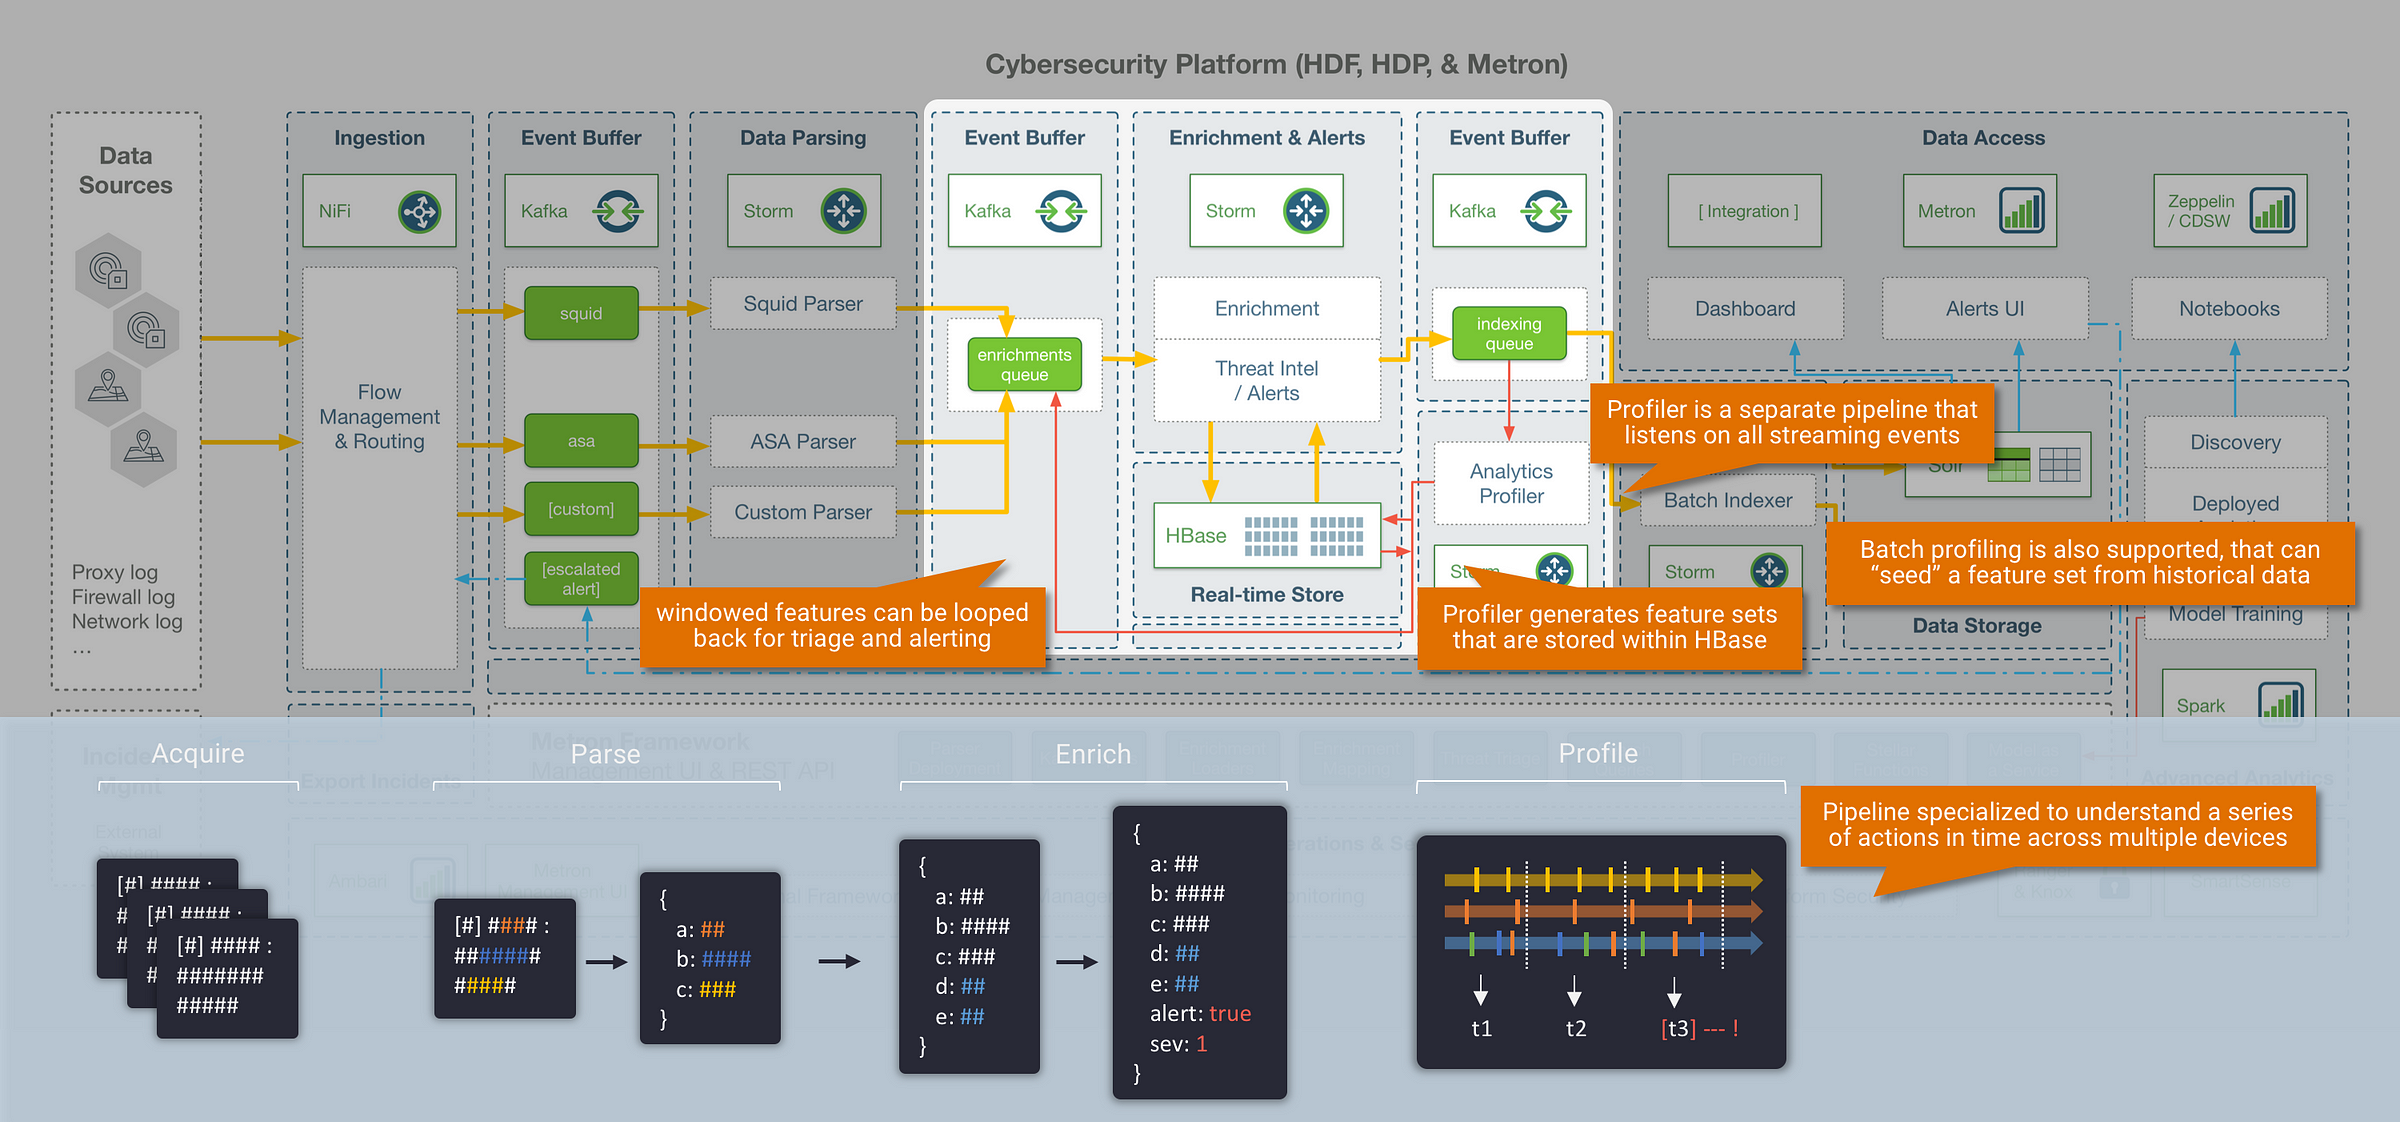
Everything we have covered up to this point in terms of parsing and enrichment is happening within the context of a single message event. However, some of the most important insight will come from understanding your data as a series of actions in time. This is where the Metron profiler comes in: the profiler is a generalised solution for extracting model features and aggregations over time from high throughput streaming data. This effectively gives us the ability to generate profiles that describe the behaviour of an entity (where an entity could be a user, host, subnet, application etc). Once we can describe the behaviour of an entity, it opens up some interesting use cases such as streaming similarity and anomaly detection against normal behavioural patterns.
The profiler in Metron runs as a separate Storm pipeline that passively listens to all incoming streaming events as they are processed through the platform, and generates features at the end of each stream window. These feature sets are stored within HBase or optionally looped back through the enrichments pipeline for triage and alerting. In addition to profiling data in a live stream, Metron also provides the ability to “seed” a feature set from historical data with a Spark based batch profiler.
|| So how do we perform behavioural profiling at massive scale?
An important consideration in high volume streaming analytics, is that many standard algorithms and functions aren’t suitable in an environment that needs to process hundreds of thousands of events per second. To solve this, many streaming systems leverage approximation algorithms, which are specialised algorithms that can produce results orders-of-magnitude faster within mathematical proven error bounds. The Metron framework supports a set of these approximation algorithms within the profiler. The most useful algorithms and features provided within the Metron profiler include:
- HyperLogLog (Cardinality) – “how many servers does this user talk to usually?”
- Bloom Filters – “have we seen this domain before?”
- T-Digest (distribution) – personalised baselining and statistics
- Counters and descriptive statistics – quick results and triggers for more intensive calculations
- Mixed period windows – non-standard windowing to account
Finally (although happening in near real-time), the last stage in the streaming pipeline is the indexing layer. The Metron framework leverages two separate storage layers, and writes to each of these using separate indexing jobs:
Random Access Layer (Hot Tier)
- Data is indexed in Solr (or ElasticSearch as a supported alternative) which provides a backend for the Metron Alerts UI, and also allows for external visualization tools to be connected to the data for additional triaging (for example: ZoomData)
Historical Layer (Warm/Cold Tier)
- Data is stored in HDFS long-term for historical access and analytics. With the data available in HDFS, this opens up a range of tools for security data scientists to train against historical data and improve alerting models. Most commonly, tools such as Apache Zeppelin or Cloudera Data Science Workbench (CDSW) can be used as a way to enable self-service data science against this data (leveraging Apache Spark as the underlying compute engine).
Final Thoughts
We have covered a lot!
The goal of this post was to provide some insight into the architecture of Apache Metron, but also serve as a general-purpose reference of things to consider when building your own streaming data engineering pipeline and framework. If you’re interested in learning more about Metron, you can reach out to the open source community via the user mailing list (https://metron.apache.org/community/).
Source: Anatomy of a Streaming Data Engineering Pipeline
Related Blogs:
