Looker Studio: Turning Data into Insightful Stories
Imagine this scenario:
You’re a marketing manager. Each morning, your inbox overflows with CSV exports: Google Analytics numbers, ad platform dashboards, social media export files, CRM spreadsheets. You spend hours copying, pasting, and combining these silos to create a report for your boss. By the time you’re done, some data is stale, formatting is inconsistent, and stakeholders start asking for real-time views instead of end-of-day summaries.
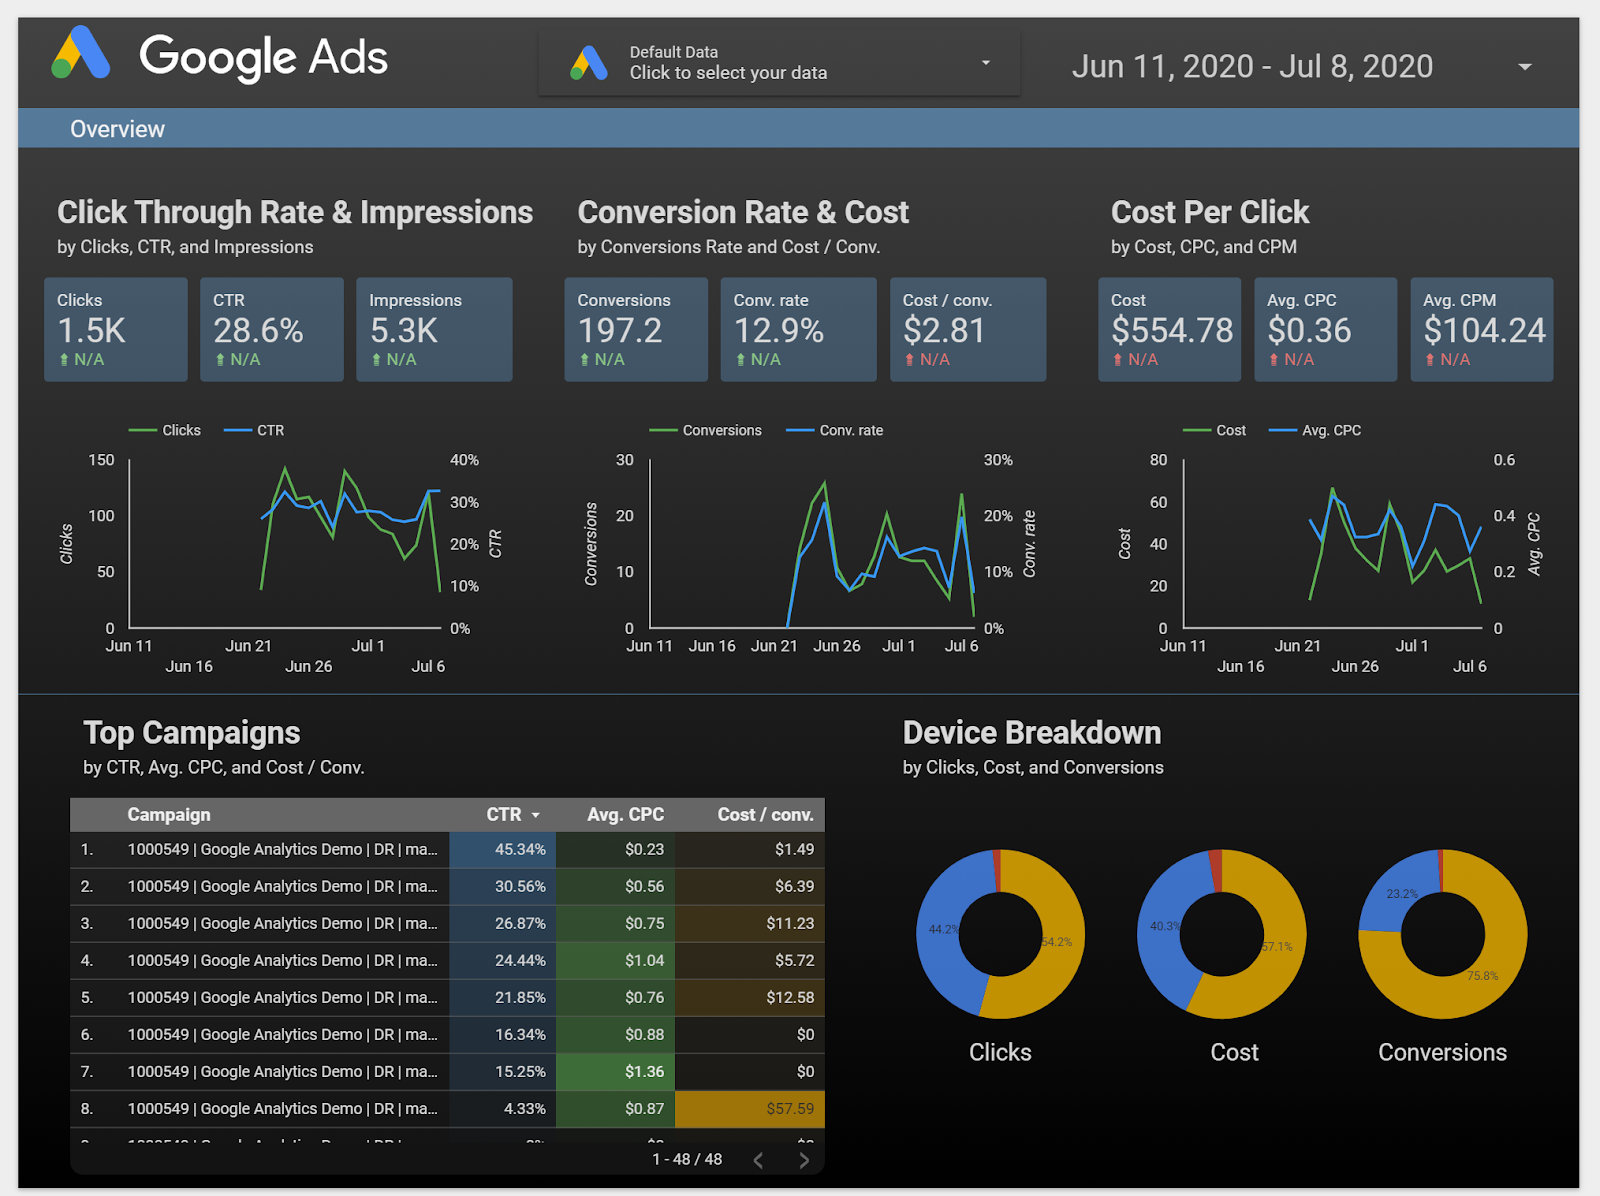
Wouldn’t it be better if, instead, you clicked a single dashboard link and saw the latest metrics from all sources—live, visual, interactive—ready to explore?
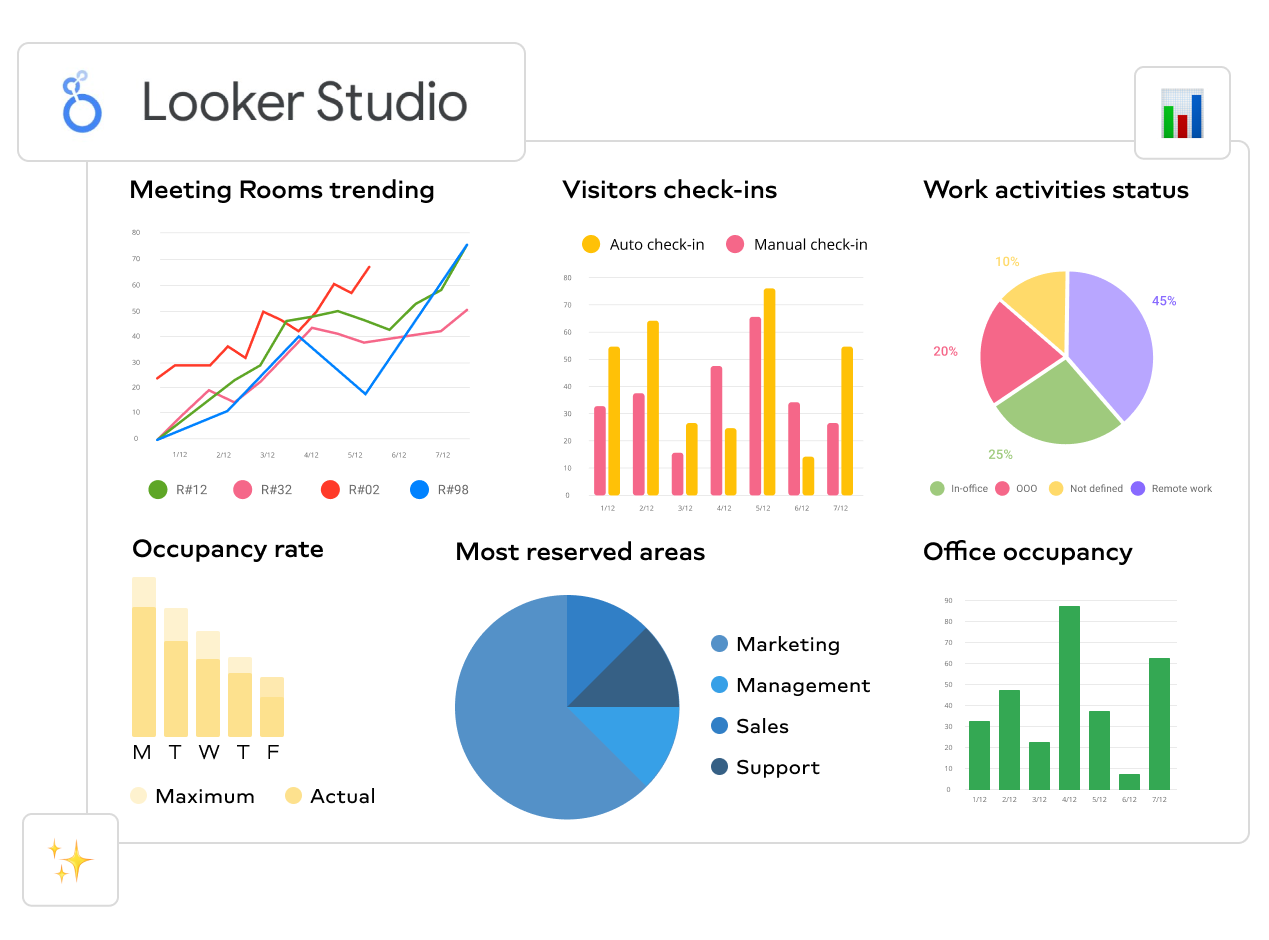
That’s exactly the promise of Looker Studio. It’s Google’s free (or optionally upgraded) data visualization and reporting tool that helps turn fragmented data into cohesive, beautiful, shareable dashboards. Instead of manual stitching, Looker Studio lets you connect, visualize, and tell data stories in minutes.
What Is Looker Studio?
Looker Studio (formerly “Google Data Studio”) is a cloud-based, browser-accessible tool for building dashboards and visual reports from multiple data sources. It enables non-technical users to drag and drop charts, tables, filters, and controls to build interactive views of their data.
Key characteristics:
- Self-service BI: Designed for users to build their own reports without heavy engineering.
- Data connectors: Over 600 connectors to bring in data from Google Analytics, BigQuery, Google Sheets, SQL databases, advertising platforms, and more.
- Interactive & dynamic: Reports update when the underlying data changes; dashboards are interactive (filters, date pickers, drill-downs).
- Shareable & embeddable: You can share reports with people inside or outside your organization, or embed them in websites/intranets.
- Free tier + Pro version: Looker Studio remains available at no cost; but Google offers Looker Studio Pro for teams needing better content management, collaboration, and enterprise features.
History & Evolution of Looker Studio
- Originally released as Google Data Studio in 2016 as part of Google Analytics 360 suite.
- In 2022, Google rebranded Data Studio to Looker Studio, aligning it under the Looker / BI family after acquiring Looker.
- The rebranding also came with promises of deeper integration, improved governance, and new features like Looker Studio Pro.
Looker Studio sits in Google’s analytics & BI ecosystem, complementing tools like BigQuery (data warehouse), Dataflow (ETL/streaming), Vertex AI (machine learning), and Looker proper (enterprise BI modeling).
Use Cases & Problem Statements Solved with Looker Studio
Why do organizations adopt Looker Studio? Because it addresses common pain points around data, visualization, reporting, and collaboration. Below are several scenarios.
- Unified Analytics Reporting
Problem: Data sits across Google Analytics, ads platforms, CRM, spreadsheets, and SQL databases. Reporting is manual, error-prone, and siloed.
Solution with Looker Studio: Connect all these sources in one dashboard. Show sessions, conversions, ad spend, customer metrics side by side with filters and shared context.
- Marketing & Campaign Dashboards
Marketers love Looker Studio because they can build SEO dashboards, PPC performance views, social media metrics, and more—all linked, interactive, and up to date.
- Executive Dashboards & KPI Reports
Build clean dashboards for C-level consumption—scorecards, trend lines, bullet charts—allowing execs to dig in on demand.
- Product & UX Analytics
Product teams can visualize user behavior funnels, retention curves, feature usage, and UX metrics without heavy dev support.
- Client Reporting & Agency Dashboards
Agencies can prepare dashboards for clients by blending data sources (analytics, ads, owned data) and embedding dashboards on client portals.
- Real-Time or Near-Real-Time Monitoring
Because Looker Studio reports update as data updates (especially when backed by real-time sources like BigQuery streaming), dashboards can serve as live monitors.
- Embedded Reporting in Apps / Customer Portals
Rather than build reporting UIs from scratch, embed Looker Studio visuals into your applications or websites, giving users custom dashboards.
Narrative Example
A SaaS startup used to send monthly PDF reports to clients. They switched to Looker Studio embedded dashboards. Now clients log in anytime, explore their own metrics, filter by date, and get up-to-date insights—saving the analytics team countless hours and supporting product transparency.
Pros of Looker Studio
Looker Studio has many advantages that make it a favorite among analysts, marketers, and decision-makers. Let’s break down its strengths from an experience and authority perspective.
Ease of Use & Low Barrier to Entry
The drag-and-drop interface, snap-to-grid canvas, intuitive property panels, and templates let non-technical users build dashboards quickly.
Rich Data Connectivity
With hundreds of built-in connectors, you can bring in data from Google Analytics, Google Ads, BigQuery, SQL, Sheets, CSV files, and partner platforms—all without code.
Real-Time / Auto Refresh
Reports dynamically refresh when the underlying data changes. You no longer need to manually export spreadsheets.
Collaboration & Sharing
Multiple users can edit and view reports; you can manage permissions, share links, or embed dashboards.
Custom Calculated Fields, Blending & Transformations
You can create calculated metrics, custom fields, blended data sources to unify schemas, and join data on dimensions.
Community Visualizations & Extensibility
If native chart types don’t suffice, you can build Community Visualizations using JavaScript, HTML, CSS — extendable visual options.
Cost / Accessibility
The base version is free, so small teams or individuals can adopt without licensing cost. Pro version adds enterprise features.
Google Ecosystem Synergy
Because it’s part of Google Cloud’s platform, integration with BigQuery, Google Analytics, Sheets, and other Google products is tight and well-supported.
Limitations of Looker Studio
Every tool has trade-offs. Here’s where Looker Studio faces challenges:
Performance / Latency with Large Datasets
When datasets are large or queries complex (e.g. many joins, complex filters), dashboards can slow.
Limited Advanced Analytics
It’s excellent for visualization but not meant as a full-fledged analytics engine. Tasks like predictive modeling, heavy statistical analysis, or custom ML usually require external systems.
Governance & Versioning Constraints
While reporting and sharing are strong, version control, deployment pipelines, and staging workflows are less mature than enterprise BI tools.
Dependency on Connectors
If a desired connector is unavailable or limited, you may need to build a custom connector or pipeline. Also, some connectors (especially third-party) may incur cost or latency.
Pro Feature Lock-in
Certain enterprise features (team workspaces, content management, advanced sharing) require the Pro subscription.
Mobile / Responsiveness Constraints
Dashboards may not always render ideally on mobile devices; layout and usability can suffer without careful design.
Alternatives to Looker Studio
If Looker Studio doesn’t meet all your needs, here are other BI / visualization options:
- Looker (full BI platform) — more enterprise, with modeling (LookML), advanced governance
- Tableau — rich analytics, deep data exploration
- Microsoft Power BI — strong in Microsoft ecosystems
- Mode Analytics, Metabase, Redash — open-source / lightweight BI
- Grafana — focused more on time-series / metrics dashboards
- QuickSight (AWS) — AWS-native alternative
Each has trade-offs in cost, complexity, flexibility, and ecosystem.
Ecosystem & How Looker Studio Fits with GCP / Analytics Stack
Let’s talk about connections — how Looker Studio fits into the larger data & AI stack.
- BigQuery as Data Warehouse
One of the most common pairings: store your data in BigQuery, then connect Looker Studio dashboards directly to it. This gives high performance, scalability, and minimal ETL overhead.
- ETL / Data Pipelines (Dataflow, Datastream)
Use Google Dataflow or Datastream to move or transform data into a uniform warehouse schema, then visualize via Looker Studio.
- Vertex AI & Machine Learning Integration
If you generate predictions or segmentation data via Vertex AI / ML models, you can visualize them in Looker Studio. This bridges analytics with AI outcomes.
- Google Analytics / Ads
Looker Studio has native connectors to Google Analytics, Ads, Search Console, etc. — making it ideal for marketing and web analytics dashboards.
- Sheets, CSV, SQL
Data can come from Sheets, uploaded CSVs, MySQL, PostgreSQL, etc. via connectors and data blending.
- Embedding & API / Automation
You can embed dashboards in applications/intranets or automate management (assets creation, migration) using the Looker Studio API.
- Community Visualizations
Extend visual capabilities using custom JS/CSS visualizations for charts not natively supported. This integration makes Looker Studio a front-line tool for many data stacks: from raw data to insights, and from ML outputs to dashboards.
Upcoming Updates & Industry Insights of Looker Studio
Looker Studio is evolving. Here are trends, features in preview or recent introduction, and direction to watch:
– Looker Studio Pro & Advanced Features
The Pro tier adds content management, team workspaces, enterprise governance, and support.
Pro also adds integration with Gemini (AI assistance in building dashboards) and easier migration between projects.
– Integration with AI / Generative Features
Looker Studio is beginning to integrate AI features — e.g. auto-calculated fields via natural language prompts, easier data wrangling using AI.
– More Data Connectors & Real-time / Streaming Support
New connectors are being added frequently. Streaming / near-real-time dashboards (with incremental refresh) are becoming better supported.
– Better Governance & Deployment Tools
Expect improvements around versioning, staging / dev / prod workflows, migration tools, backup/restore, and audit trails.
– Performance, Caching & Query Optimizations
To support heavier datasets with smoother user experience, optimizations, query orchestration, and caching layers are being improved under the hood.
– More Community & Ecosystem Growth
Greater adoption in non-Google ecosystems, more community visualization libraries, and partner tools built around Looker Studio.
Project References of Looker Studio
Frequently Asked Questions of Looker Studio
Q1: Is Looker Studio really free?
Yes — the base version is free for creators and viewers. The Pro tier adds enterprise-level features (team management, content control, API access).
Q2: How many data connectors does Looker Studio support?
Over 600 connectors (Google and partner-built) to various data platforms, databases, advertising, analytics, and cloud sources.
Q3: Can I write custom JavaScript visualizations in Looker Studio?
Yes — via Community Visualizations, which allow you to build or import custom visual code.
Q4: Is it real-time?
Looker Studio dashboards reflect data changes when the underlying data updates. The degree of “real-time” depends on connector and data pipeline.
Q5: How does Looker Studio compare to Looker (full BI)?
Looker (the BI platform) is more powerful for modeling (LookML), governance, large-scale enterprise BI. Looker Studio is more lightweight, ideal for dashboards and reports but less strong in data modeling.
Q6: Can I embed Looker Studio in my app or website?
Yes — reports are embeddable, allowing users to view dashboards within portals or apps.
Q7: How does Looker Studio connect to BigQuery?
You can connect reports directly to BigQuery tables or views, enabling you to visualize your warehouse data live.
Third Eye Data’s Take on Looker Studio
While Looker Studio (formerly Data Studio) is a powerful free dashboarding tool, our public positioning emphasizes more enterprise / scalable BI tools like Looker itself. At Third Eye Data, Looker Studio might serve in lighter or ad-hoc reporting use cases, internal analytics, or proof-of-concept dashboards—but it is not our flagship visualization tool in published client-facing solutions.
In the ever-expanding world of data, insights matter more than raw numbers. But insights only matter if they’re accessible, interactive, and understandable. That’s where Looker Studio shines.
From siloed exports to unified dashboards, from data novices to power users, Looker Studio cuts through friction. Its strengths in connectivity, interactivity, cost-effectiveness, and blend of UX + data capability make it a top pick for many organizations.
Whether you’re a marketer needing campaign dashboards, a product manager visualizing usage, or a business leader watching KPIs, Looker Studio can become your go-to visualization layer.
Call to Action:
Don’t just read — build. Spin up a free Looker Studio account, connect two or three data sources (Google Analytics, a CSV, maybe a SQL table), and build your first dashboard today. Share it with your team. See how powerful “just click and visualize” can be.

