Time Series Classification with Neural Network
Deep Learning models generally extract features in the early layers of the network. It does away with the need for manual feature engineering making it attractive ML technique. However, this not always the case, time series clustering and classification being some examples, unless you use complex solution involving RNN and MLP. Time series forecasting is easier. You can feed raw time series data to auto regressive DL models like Transformer or LSTM. In this post we will use a feature engineering technique called interval statistics to engineer features for a time series to be used in a classification model based on MLP with one hidden layer.
The feature extraction implementation is my Python package for time series called zaman. For the MLP I have used my PyTorch no code framework in a Python package called torvik. The code is in my Github repo whakapai.
Interval Statistics based Feature Engineering
For classification and clustering using raw time series as input is challenging because of alignment issue. There are various techniques for feature extraction from time series classification. We will use a technique called interval statistics as below. The input consists of many samples of time series of fixed length.
- Decide on the number of intervals
- Generate some random intervals confined within the length of the time series samples. Each interval is defined by it’s starting offset and the interval length.
- For each TS sample for each interval calculate mean, std deviation and slope of the interval. The number of generated features will be 3 x number of intervals. if used 3 interval, then each TS sample will generate 9 features.
The intervals could be overlapping or not overlapping. My implementation for interval based feature extraction provides the options. However, it makes sense to make the intervals non overlapping for maximum coverage. The interval length is also an important parameter. A range is provided to the API and it samples uniformly within the range for the interval length.
Machinery Vibration Use Case
It’s assumed for our use case that a machine component has 2 kinds of faults, each characterized by the presences specific frequency components in the vibration data. In reality, the TS segments where the fault occurs would have been identified and extracted using some anomaly detection techniques. We have generated the time series segment data corresponding to the two faults synthetically. Here are some sample time series data for the 2 kinds of faults


The data has been generated with a time series generating Python module in zaman. There are various kinds of time series supported. One of them is based on a set of sinusoidal components. All the parameters for the time series generation is specified in a configuration file. Here is a post that provides more details on the time series data generation process.

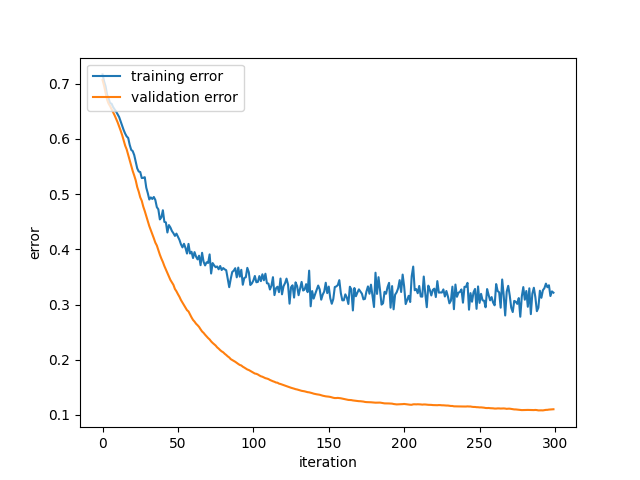
With validation loss lower than training loss, you may raise your eyebrows. But it can happen when there is regularizer which pushes the training loss upward. I used drop out which is essentially L2 regularization.
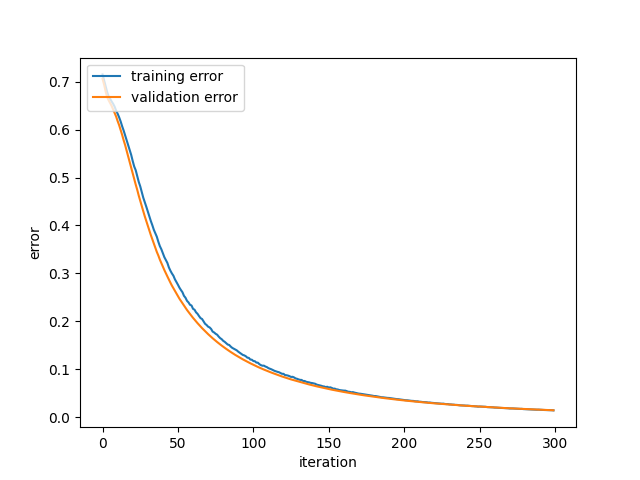
When I removed the drop out this how the loss curves look like which is more in line with the expectations of most people.

It turns out, for this model it doesn’t matter whether I use dropout or not, as far as test data performance is concerned. For the synthetic data I used, test data performance is near perfect. Probabilistic prediction output for test data is slightly better without dropout. Some of the important parameters are adam optimizer and binary cross entropy loss. The model was not auto tuned. Here is some validation output, where the output is probability.
predicted 	actual
0.003		0.000
0.000		0.000
0.047		0.000
0.977		1.000
0.977		1.000
0.977		1.000
Here is a tutorial document with detailed instructions on how to train and validate the model. If you are trying a different time series data set, you should change the configuration parameters appropriately.
Pure Deep Learning Solution
You could use raw time series directly without exploit feature engineering, but the solution will require RNN or LSTM followed by an MLP. RNN or LSTM will extract time series features which will feed into the MLP for classification. The two networks need to be trained together. The paper cited has such a solution for predicting cardiac arrest. IMO, the solution presented in this post is simpler.
Concluding Thoughts
Although Deep Learning model relives us from the task of engineering feature, it’s not always the case. Time series is a good example. In this post we have used a time series feature engineering technique called interval statistics to train a MLP classification model. The features extracted could be used for time series clustering also.
The goal of this post to provide a solution for time series classification. It shouldn’t be construed as making a trained model available that will work for any time series. You have to try it for your time series, including any model tuning that may be necessary. There is no guarantee it will work for your time series data set.


