Recent Gun Violence
Mass Shooting Analysis 2014-2019
Gun Violence Analysis Involving all ages
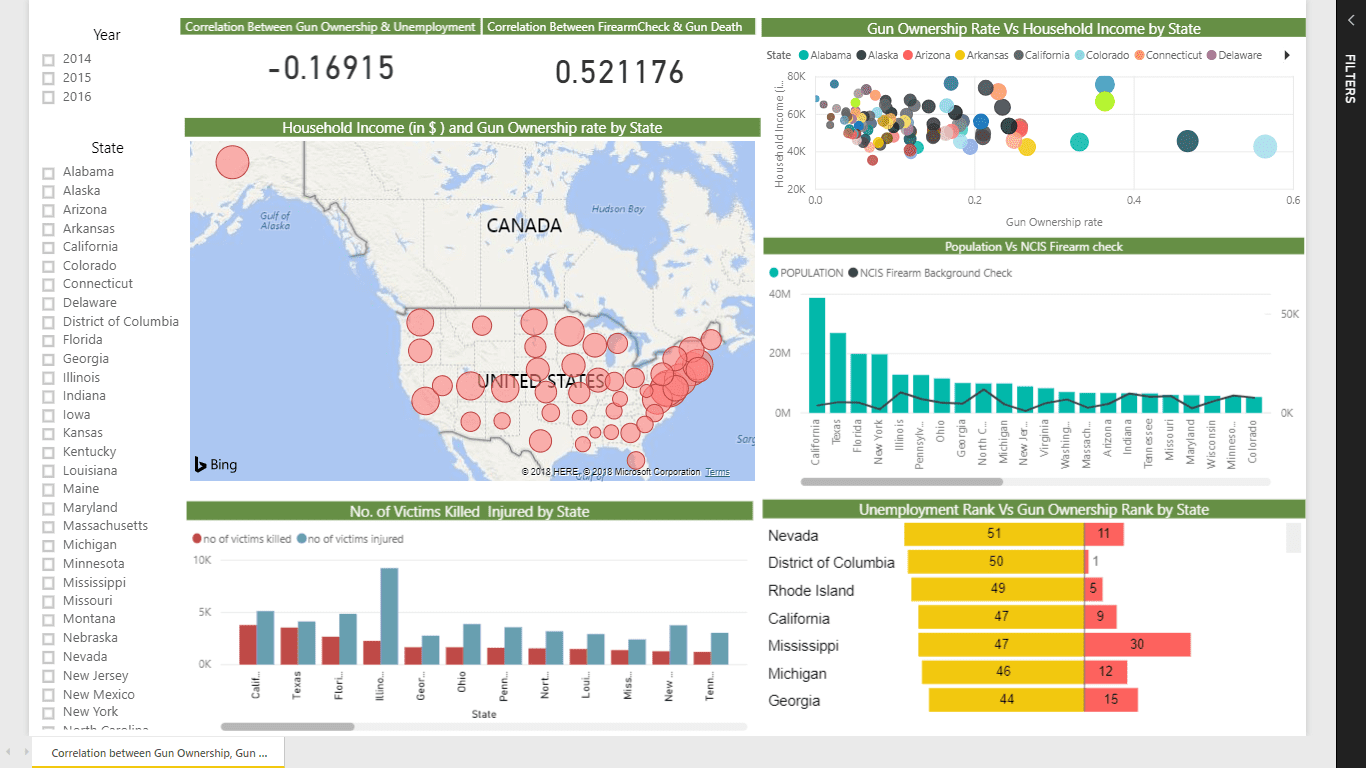
Correlation between Gun Violence & its probable cause.
Gun Violence Analysis Involving all Ages
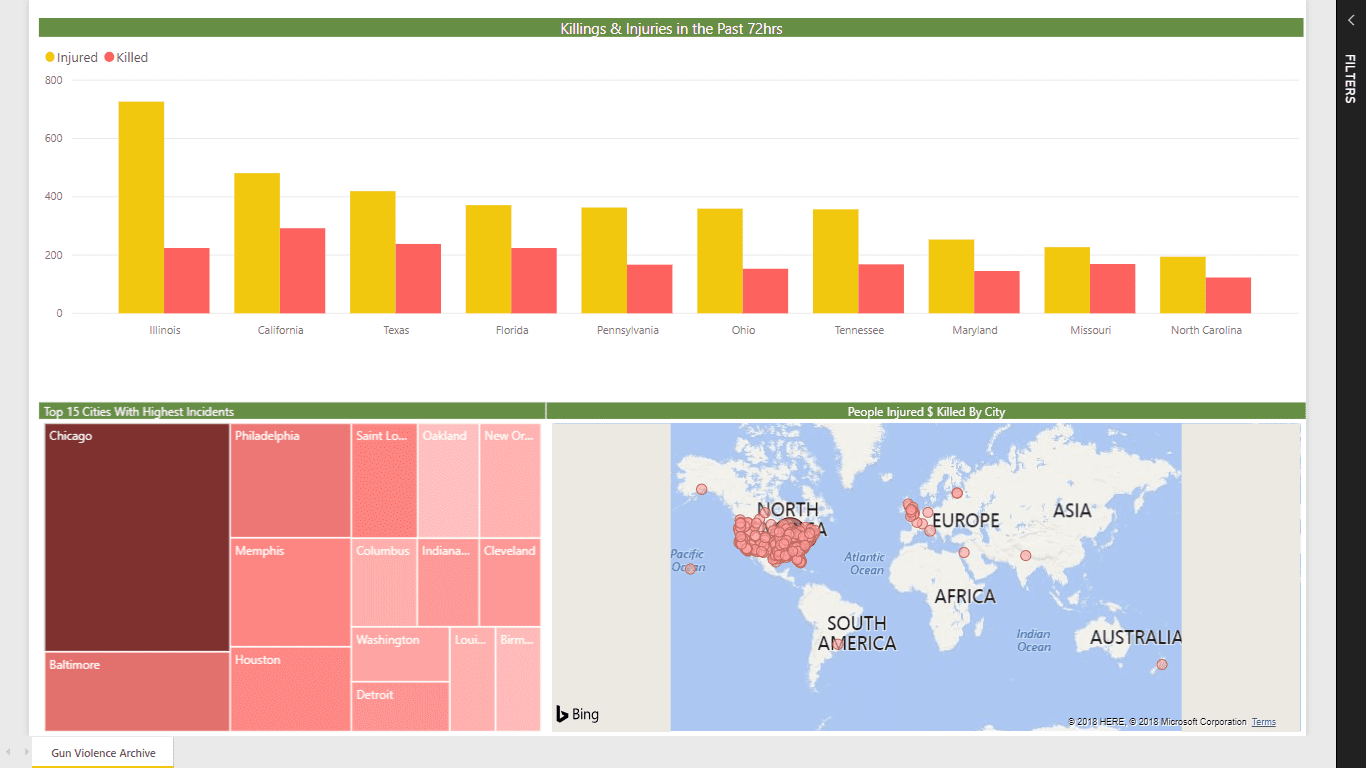
The people who were killed in firearm assault came from nearly every imaginable race, religion and socioeconomic background. Their ages range from the unborn to the elderly. In addition, thousands of survivors were left with devastating injuries, shattered families and psychological scars.
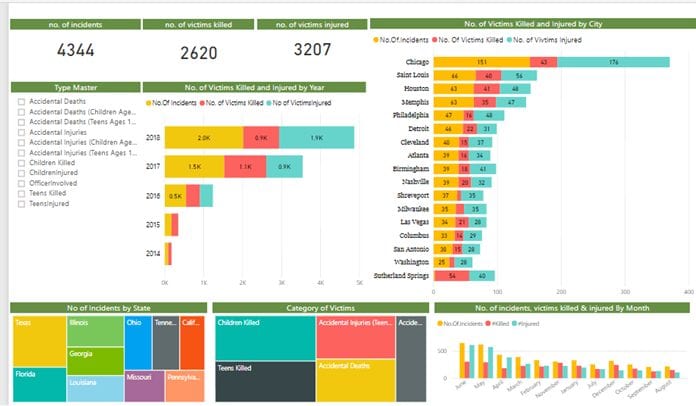
- At the top there are three counts of the total incidents that occurred and the count of people who got killed and injured respectively.
- The Type slicer lists every possible category that a victim could fall in. We can view the reports based on a particular category or without any filter.
- There are detailed reports based on the statistics of the number of incidents and number of people killed and injured by year and city.
- A comparative analysis tells us that the majority of victims are children followed by Teens and accidental injuries.
- The first tree map shows the states with highest rate of violence. Bigger area implies more injuries.
Transforming Enterprises with
Data & AI Services & Solutions.
ThirdEye delivers Data and AI services & solutions for enterprises worldwide by
leveraging state-of-the-art Data & AI technologies.