Gun Violence and Its Root Causes: A CorrelationGun Violence and Its Root Causes: A Correlation
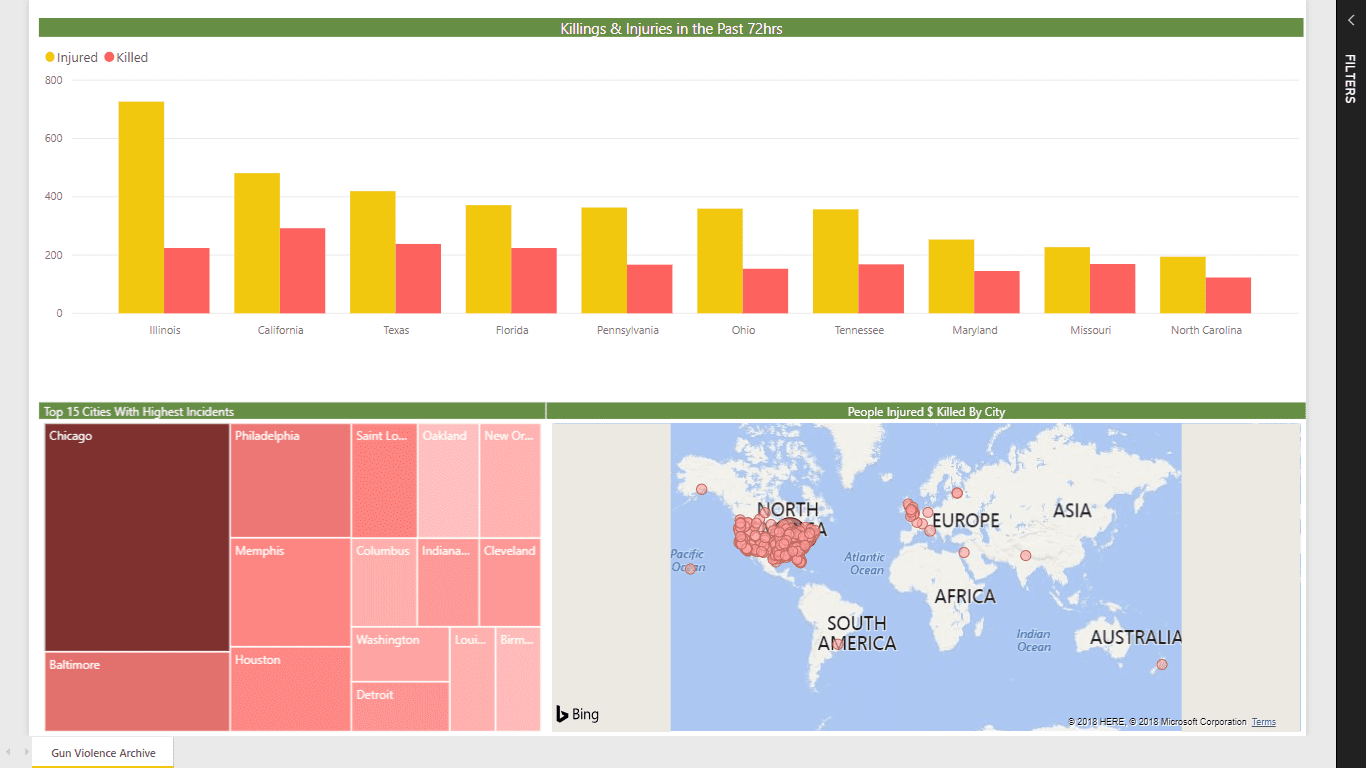
Mass Shooting Analysis 2014-2019
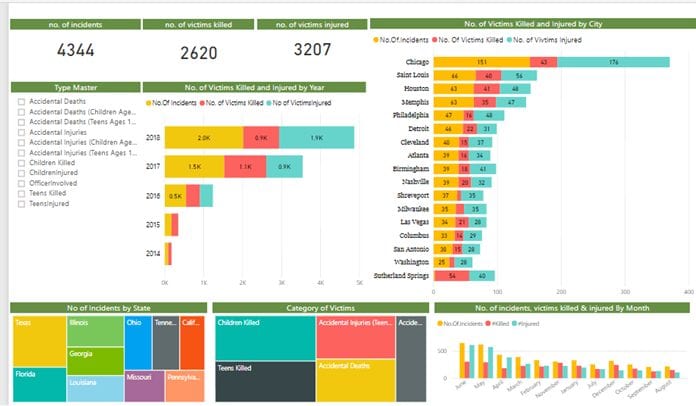
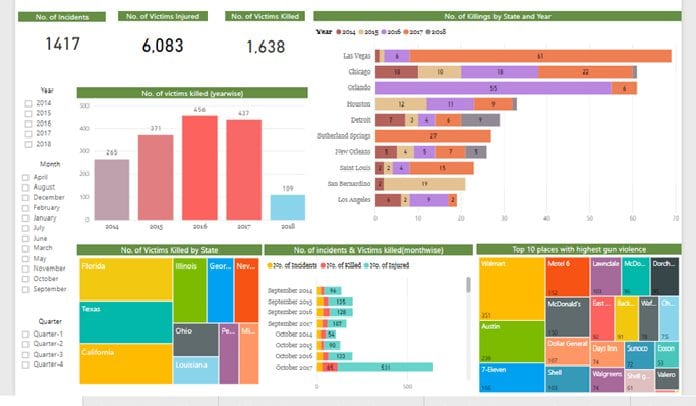
Gun Violence Analysis Involving all ages
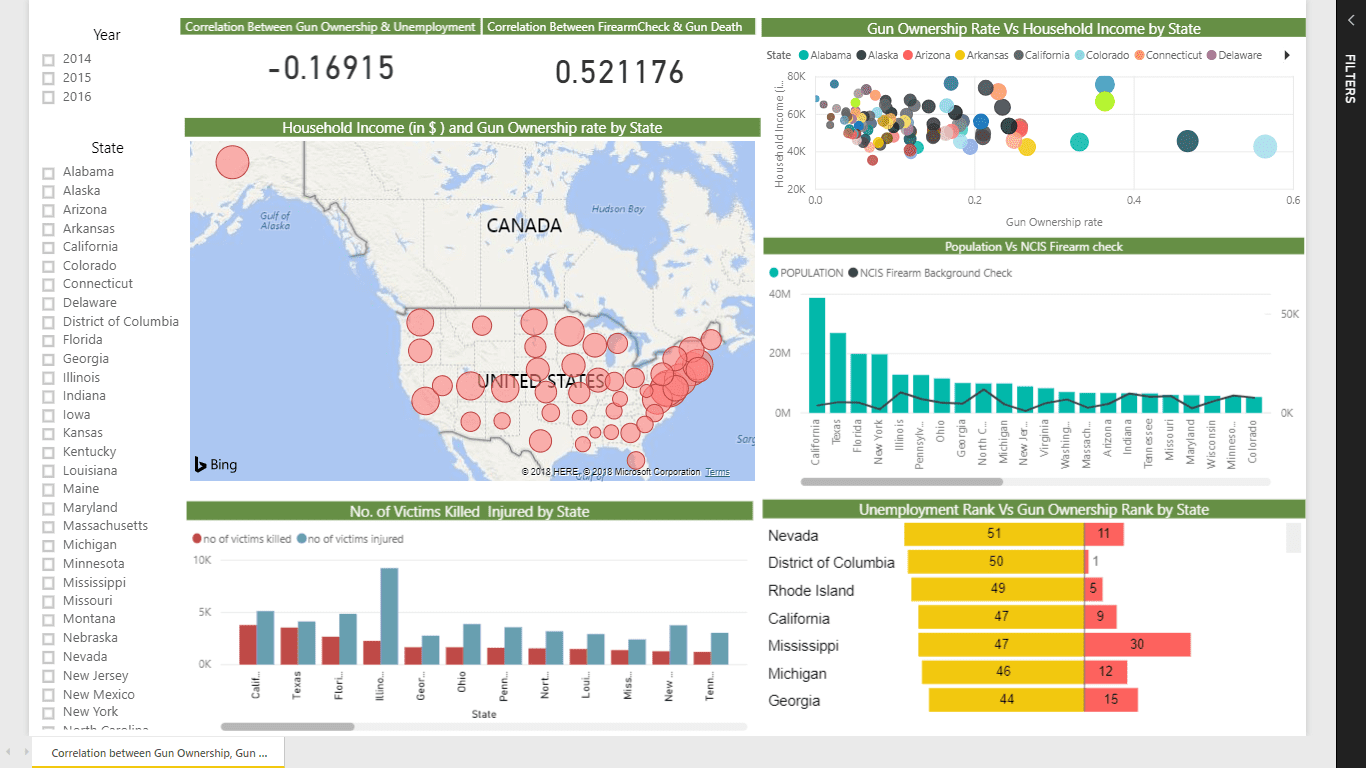
Correlation between Gun Violence & its probable cause.
Correlation between Gun Violence & its probable cause.
States with higher rates of gun ownership generally have higher gun death rates than those with lower gun ownership rates, according to an analysis of 2013 data from the peer-reviewed journal Injury Prevention and the Center for Disease Control and Prevention by Mother Jones.
- In the United States, anybody who wants to buy a gun from a federally licensed firearms dealer (FFL) is subject to a background check. Therefore the Gun Ownership Ratio is calculated based on the summation of the total population divided by the summation of NCIS firearm background check.
- The combined graph report relates population with gun ownership. As the population increases we see a growth in the gun ownership in that state.
- The map shows the gun ownership rank state wise. The colour appears darker in regions with higher ownership.
- Gun death rate is calculated by dividing the summation of population by summation of number of gun deaths.
Transforming Enterprises with
Data & AI Services & Solutions.
ThirdEye delivers Data and AI services & solutions for enterprises worldwide by
leveraging state-of-the-art Data & AI technologies.