

How to Debug Map-Reduce Code
It All Starts with HDFS
Everything in Hadoop cluster is based on the HDFS (Hadoop Distributed File System). Quite often HDFS problems will manifest themselves in various components of Hadoop framework. This might show up as an intermittent failure, permission issue, failure to write, or failure to retrieve data blocks, etc. Sometimes the root cause is found in the HDFS itself. Meaning, the Hadoop cluster could be unbalanced, some of the datanodes might be overloaded or there is simply not enough space. The good news is that the Hadoop framework provides a powerful tool to analyze the current state of HDFS and make necessary corrections if needed.
Analyzing the Framework
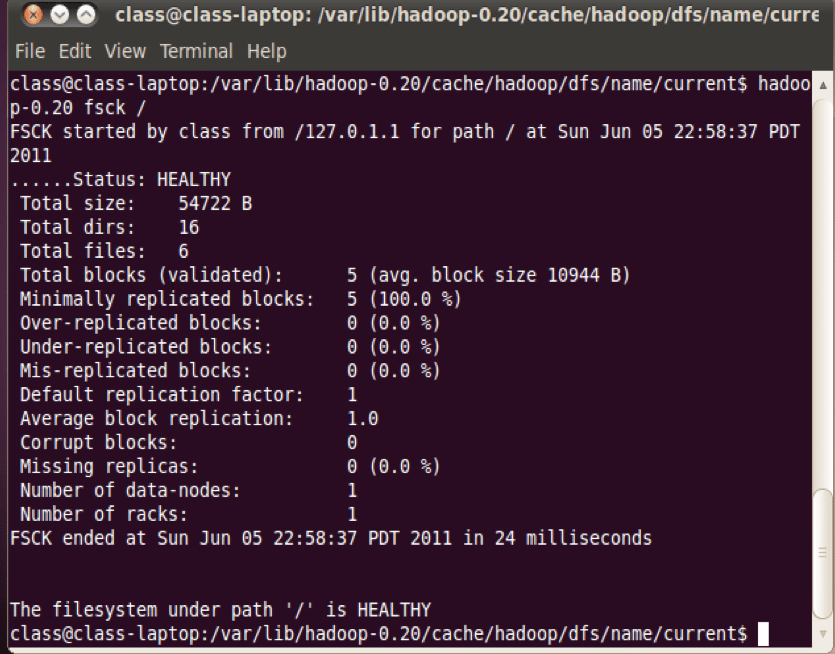
HDFS Command: Hadoop “fsck”
The most commonly used option for analyzing the framework is “/” which will analyze the entire file system and report any abnormalities. However, as HDFS grows, it will take longer and longer to execute the “fsck” utility. If a particular folder is suspected to have a problem, the path can be specified to verify that folder only.
For instance :

Running the cluster after Failure Outages
It is especially important to run the “fsck” utility after any kind of outages in the system. This can help determine if the outage is caused by:
- Failover to standby namenode: “fsck” will make sure that HDFS is fully accessible and has the same number of files and blocks as before failover;
- Worker node outage: A datanode outage can happen for various reasons, including hardware issues or network interaptions.
Statistics Provide Insight
Statistical studies show that the failure probability of a Hadoop worker node is about 1 percent. That means on a 100 node cluster, a node is down at any given point of time. It is advisable to recover a failed node as soon as possible in order to alleviate the pressure on the Hadoop infrastructure of the data recovery. Once the failed node comes back online and registers with active namenode, it sends the list of the data blocks to the NameNode (NM) which then takes the necessary actions to stop ongoing data recovery and delete extra replicas.
DFSAdmin Command
If the “fsck” utility does not report any issues, and yet the client receives error messages indicating HDFS issues, this could be a symptom of an issue with a particular node. Running the command “dfsadmin –report” will produce a report on the HDFS infrastructure. In the ideal case, you would want to see equal utilization across all nodes with at least 20% of space still available on each node.
The Balancing Act
Quite often clusters may become unbalanced due to periodic datanode outages or usage of a dedicated datanode to load the data. If one or more nodes are not capable of storing data due to lack of space or faulty drive, it could be a reason for client error messages.
Debugging of Map-Reduce job execution
When it comes to debugging a Map-Reduce job execution, there are a few things to keep in mind. The client connects to the Resource Manager with specific number of mapper and reducer requested. The Resource Manager has information about available slots on the cluster and their real-time utilization. Thus, the Resource Manager determines the most suitable nodes for the task execution based on data locality and available slots.
During task execution there are three components involved:
- Resource Manager
- Node Manager
- Task (separate jvm running on the same node with node manager)
First Things First
The very first step in debugging a job execution is to check the list of the MR jobs currently running on the system, (yarn–list).
Secondly, make sure that there are no orphaned jobs that are running on the cluster. If a job was designed to run as a singleton, multiple instances could present you with undesirable effects. If you see the job in the list, the next step is to determine location of the RM logs, noting the location can vary from the one installation to another.
Step 1: Run: “ps –ef | grep –I ResourceManager”
and look for log directory in the displayed result.
Then, identify the job-id from the displayed list in the ResourceManager log and make sure that there are no error messages associated with that specific job.
Step 2: Based on the RM log, determine which worker node was involved in the execution of the task.
Step 3: Once the node name is determined, login to that node and run: “ps –ef | grep –i NodeManager”
Next, examine the node manager log. Unless there is an issue with hardware on the specific node, the NodeManager should not have issues. The majority of the errors you see will be coming from user level logs for each individual task. Task logs are specific to each Map-Reduce job. So, take note that you need to review your Map-Reduce code to ensure that you have sufficient logging for day-to-day debugging.
Finding the Answer
Bottom line, Hadoop is a highly distributed system. Thus, debugging Hadoop is realizing that it requires debugging a wide variety of different components, one-by-one, along the work execution chain. You may find that the issues could be with custom user code as well as the Hadoop execution framework.
Happy Debugging!

Transforming Enterprises with
Data & AI Services & Solutions.
ThirdEye delivers Data and AI services & solutions for enterprises worldwide by
leveraging state-of-the-art Data & AI technologies.


