The Visual Python Debugger for Jupyter Notebooks You’ve Always Wanted
Introducing PixieDebugger
I’ve been using Jupyter Notebooks with great delight for many years now, mostly with Python, and it’s validating to see that their popularity keeps growing, both in academia and the industry. I do have a pet peeve though, which is the lack of a first-class visual debugger similar to these available in other IDEs like Eclipse, IntelliJ, or Visual Studio Code.
Some would rightfully point out that Jupyter already supports pdb for simple debugging, where you can manually and sequentially enter commands to do things like inspect variables, set breakpoints, etc. — and this is probably sufficient when it comes to debugging simple analytics. To raise the bar, the PixieDust team is happy to introduce the first (to the best of our knowledge) visual Python debugger for Jupyter Notebooks.
Editor’s note: PixieDebugger currently only works with classic Jupyter Notebooks; JupyterLab is not yet supported.
Introducing PixieDebugger
As advertised, the PixieDebugger is a visual Python debugger built as a PixieApp, and includes a source editor, local variable inspector, console output, the ability to evaluate Python expressions in the current context, breakpoints management, and a toolbar for controlling code execution.
To invoke the PixieDebugger for a specific cell, simply add the %%pixie_debugger magic at the top of the cell and run it.
As an example, let’s consider the following sample code that finds the max value in an array.
%%pixie_debugger
import random
def find_max (values):
    max = 0
    for val in values:
        if val > max:
            max = val
    return max
find_max(random.sample(range(100), 10))
Note: As a prerequisite, install PixieDust using the following pip command:
pip install pixiedust. You’ll also need to import it into its own cell:import pixiedust.
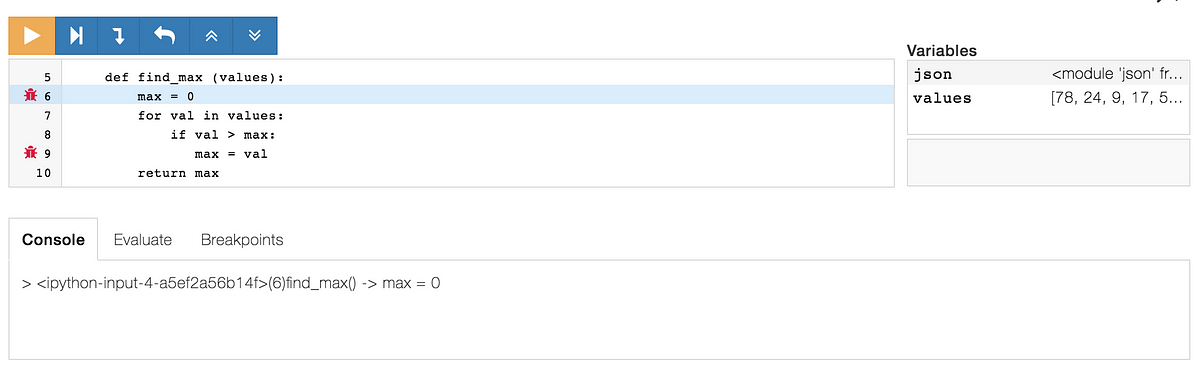
When running the cell, the PixieDebugger will automatically be invoked to break at the first executable line of code.
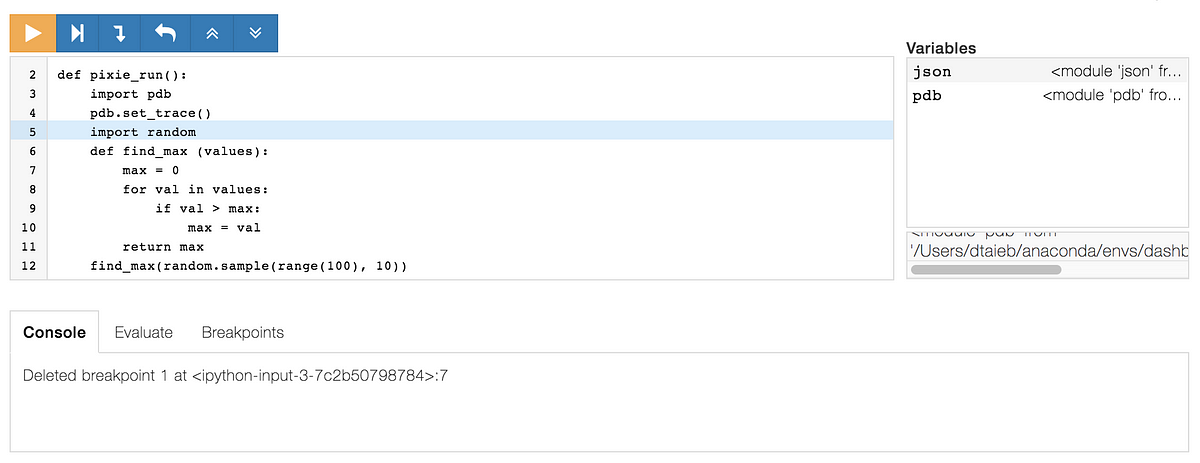
Some details to note:
- The toolbar on the top left lets you control the execution flow of your code: resume execution, step over, step into, step out, move current frame one up and one down.
- The source editor shows the current code and highlights the current line being executed. The gutter on the left shows the line numbers and an icon for each line that has a breakpoint installed.
- The variables panel on the right automatically shows the local variables for the current context.
- The console tab shows any output from the current program or the PixieDebugger.
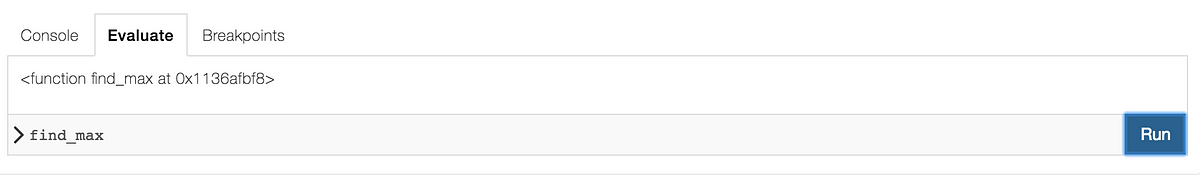
- The Evaluate tab allows you to enter any Python expression and run it to get its value.
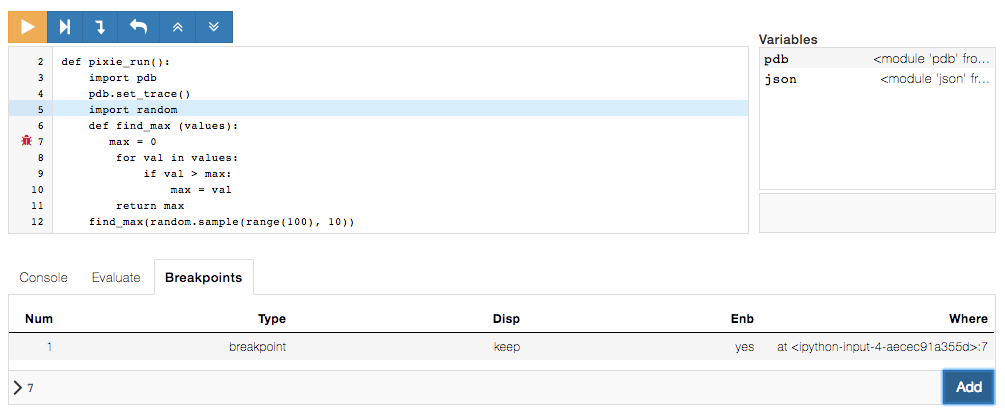
- The Breakpoints tab displays the list of active breakpoints and lets you add a new one. When you add a new breakpoint, an icon is automatically added to the corresponding line.
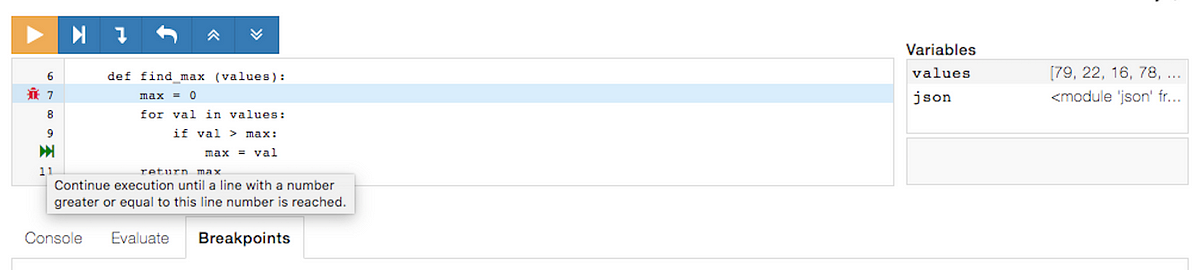
There’s also a “run to line” feature, where you can run only a portion of code. You can directly run to a specific line of code by hovering over a line number on the gutter to make the icon appear and clicking it to move the code execution to the targeted line. This can be useful when you have a for loop, and don’t want to step into each part of the loop.
Another optimization you might want to use is the ability to set breakpoints as a directive of the %%pixie_debugger magic, by using the -b argument switch, and specify a list of breakpoints separated by a space. The breakpoints can be either a method name or a line number.
Using our previous example, let’s run the PixieDebugger with 2 breakpoints: one stopping at method find_max and the other at line 9.
Note: Line 9 corresponds to line 7 in the original cell’s code. This is because the PixieDebugger is adding a few lines when running it. You should always use the line number shown in the PixieDebugger editor.
%%pixie_debugger -b find_max 9
import random
def find_max (values):
    max = 0
    for val in values:
        if val > max:
            max = val
    return max
find_max(random.sample(range(100), 10))
The code will now automatically stop at the first breakpoint we’ve set in the magic arguments.
Invoking the PixieDebugger post-mortem (after an exception has happened) is also possible with the line magic %pixie_debugger. (Notice the difference between the cell magic, which has two % symbols, and the line magic, which has only one and no argument.) This is useful to troubleshoot hard-to-reproduce errors.
The following sample code simulates a ZeroDivisionError exception. We then call %pixie_debugger in a separate cell.
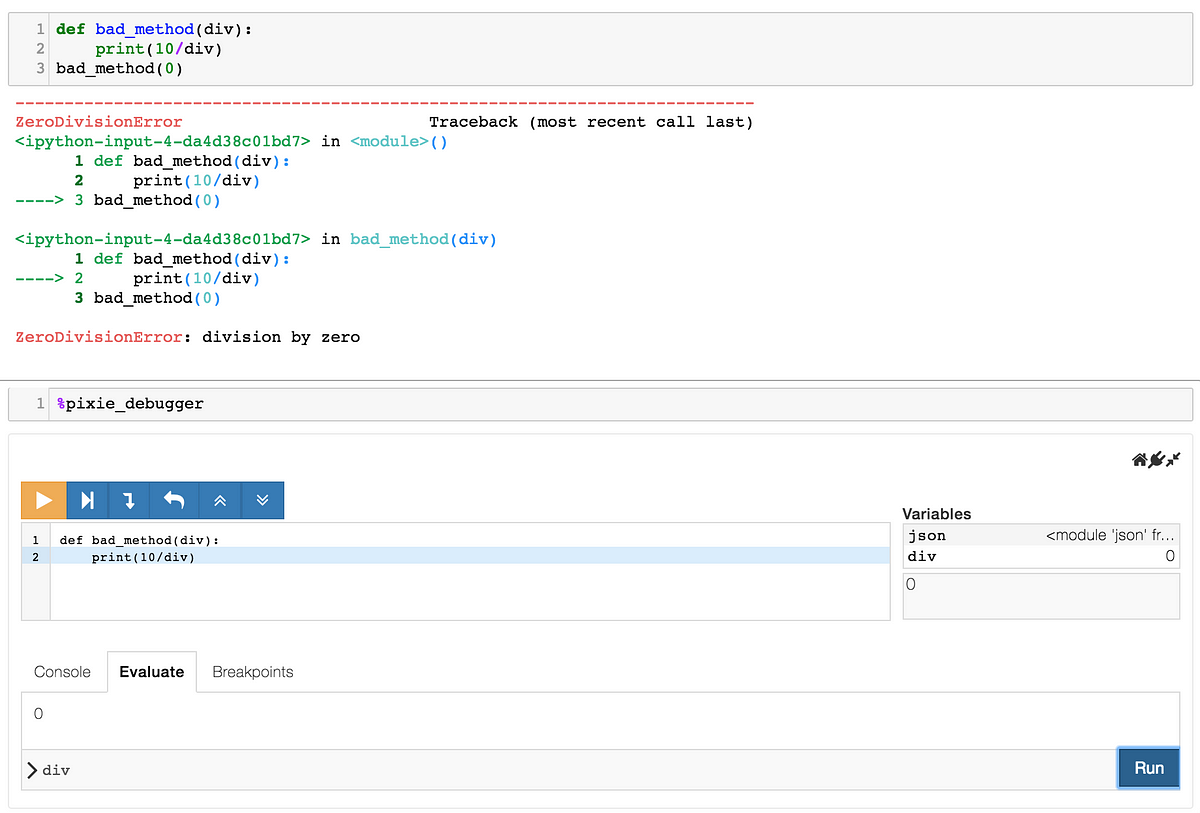
Note: When in the debugger, the main thread in the kernel is suspended; therefore, no other code can be executed until the debugging session is done. You will know that it’s safe to execute other cells when the “kernel busy” indicator on the top right of the Notebook page is back to idle.
Using the PixieDebugger to debug PixieApp routes
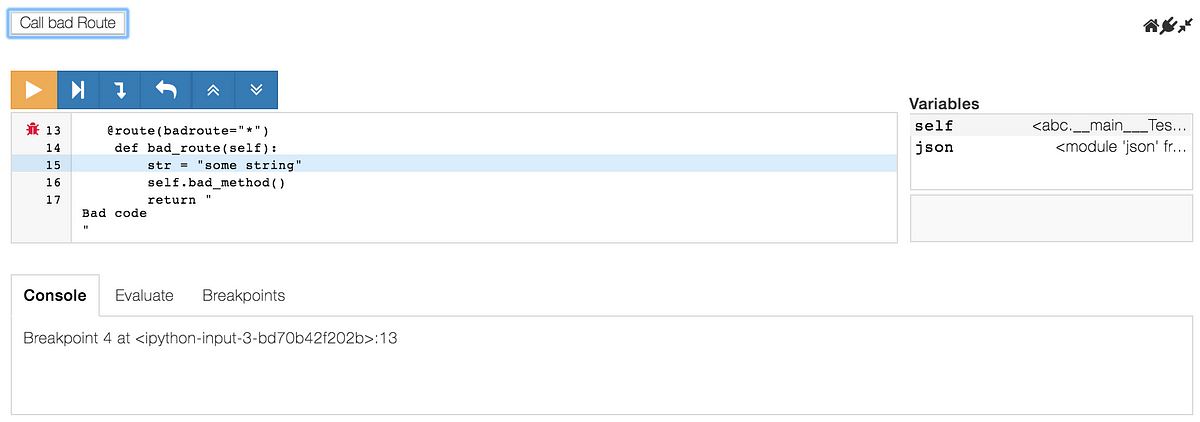
Where it becomes even more interesting is that the PixieDebugger also works to debug PixieApps. To illustrate how it works, let’s take an example of a simple PixieApp that has one button that calls a route called bad_route to populate a div element. In turn, the bad_route implementation calls bad_method, which triggers a ZeroDivisionError exception.
To debug bad_route, we simply use the debug_route keyword argument with the value “bad_route”. This will trigger the debugger when bad_route is invoked upon clicking the button:
from pixiedust.display.app import *
@PixieApp
class TestApp():
    @route()
    def main_screen(self):
        return """
        <button type="submit" pd_options="badroute=true" pd_target="target{{prefix}}">
            Call bad Route
        </button>
        <div id="target{{prefix}}"></div>
        """

    @route(badroute="*")
    def bad_route(self):
        str = "some string"
        self.bad_method()
        return "<div>Bad code</div>"

    def bad_method(self):
        var = 3/0

app = TestApp()
app.run(debug_route="bad_route")
Let’s run this cell and see how the PixieDebugger is triggered when bad_route is invoked. What’s more, the PixieDebugger is actually displayed in the target div the route is supposed to populate.
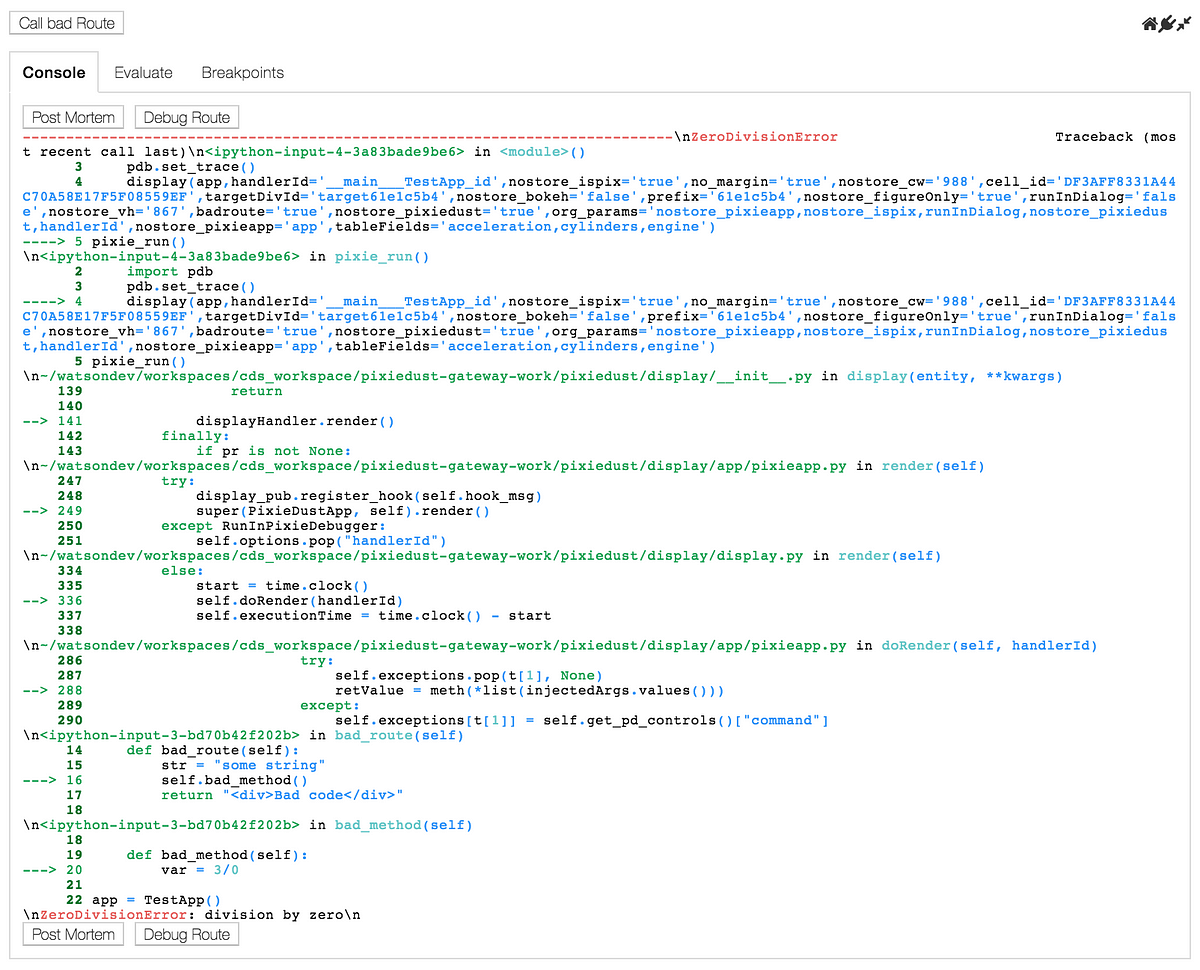
In case you didn’t specify a route to be debugged and an exception occurs, the PixieApp framework now provides an enhanced traceback with two extra buttons:
- Post-Mortem: Invoke the debugger to do a post-mortem troubleshooting session.
- Debug Route: While post-mortem is only used to inspect local variables, you can use the debug route button to replay the route, stopping at the first executable statement.
Here’s what the new traceback looks like with the sample PixieApp above:
Bugging out
The new PixieDebugger feature provides a long-awaited visual Python debugger to the Jupyter Notebook ecosystem, which takes data science notebooks one step closer to becoming a true IDE for both data scientists and developers.
The first version will be available starting in PixieDust 1.1.8, and I hope you will give it a try. As always, we look forward to your feedback on how to improve it, either by contributing a pull request or creating issues on the PixieDust GitHub Repo.
From the PixieDust team: Enjoy!
Source: The Visual Python Debugger for Jupyter Notebooks You’ve Always Wanted
Related Blogs:
Transforming Enterprises with
Data & AI Services & Solutions.
ThirdEye delivers Data and AI services & solutions for enterprises worldwide by
leveraging state-of-the-art Data & AI technologies.