Time Series Data Exploration with Wavelet Transform
Time series data provides time domain information and Fast Fourier Transform provides frequency domain information only. What if you wanted both, for example you may be interested in frequency domain information only within a specified time range. Wavelet transform provides time and frequency domain information simultaneously. In this post we will explore machinery vibration data using Wavelet transform. The implementation is in my time series Python package called zaman. Here is the GitHub repo.
Wavelet Transform
Wavelet Transform is like Fourier transform in that it decomposes a signal into a set of basis functions, which is sinusoidal at various frequencies. Unlike Fourier Transform which captures global frequency representations , the Wavelet Transform decomposes a signal into a set of wavelets that are rapidly decaying wave like oscillations. The wave shapes are defined by the wavelet family chosen. This enables wavelets to represent signal at various scales, making is useful in analyzing signals with features varying over time, from high frequency transients to slowly varying trends and anything in between.
A wavelet is a wave from decaying at both ends. There are various wavelet families corresponding various wave forms. The wavelet frequency is controlled by specifying the scale or frequency. Wavelet transformation consists of performing a convolution operation on a given time series data with a specified wavelet. The resulting time series reflects the presence of specifies frequency any where in the time series. This process can be repeated for various frequencies or scale.
To detect the presence of of some frequency anywhere in the time series, you will perform a wavelet transformation with some wavelet function at the desired frequency. On the other hand to investigate the presence of various frequencies at some instant of time, you will collect the wavelet coefficients at various frequencies for that instant of time.
There are many applications Wavelet transformation as a powerful signal processing tool. Here are are some of the areas
- Signal denoising : Reducing noise from signals
- Image compression : Maintain high compression ratio with good quality
- Image and speech data analysis: Feature detection, texture analysis, pitch detection
- Data compression: Compress data in time and frequency domain
- Communication system: Modulation, demodulation and channel equalization
- Finance: Volatility modeling, trend analysis
Machinery Vibration Data
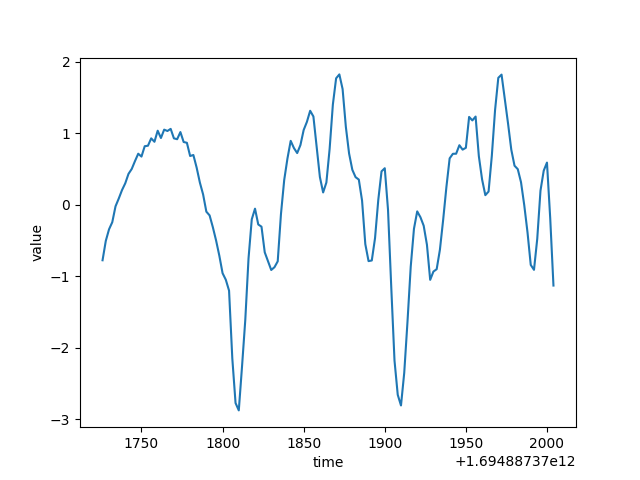
We will use synthetically generated vibration data. Frequencies present in the normal data are at 10 Hz and 20 Hz. To simulate anomaly, some high frequency components are introduced 2 secs into the time series and they last for 1 sec. We will use Wavelet transform to investigate and explore the anomaly in the time series. The plot below shows the inception of anomaly
Exploration with Wavelet Transform
Wavelet transform allows you to explore in the frequency domain at certain point in time and in the time domain for certain frequency. You can also explore for some time range and frequency range. The plot below shows the time series for certain frequency, which is 40 Hz anomalous frequency. Notice how the value hovers around zero and then sharply increases around the time anomaly occurred.
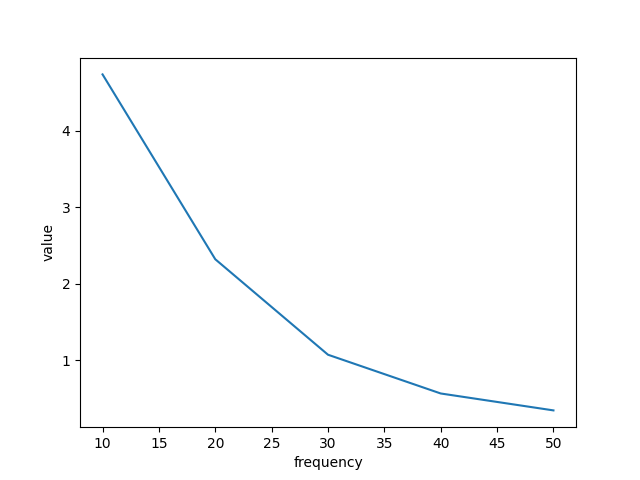
The next plot shows all frequency components at some point in time prior to the inception of anomaly. As expected there is nothing significant above the highest normal frequency of 20Hz.
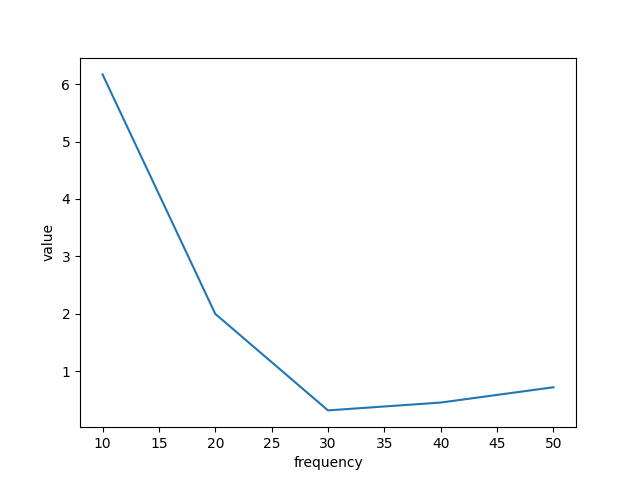
The next plot is similar except that it’s at a point in time after the inception of anomaly. Notice how the values goes up again at higher frequencies above 40 Hz. corresponding to the anomalous frequencies.
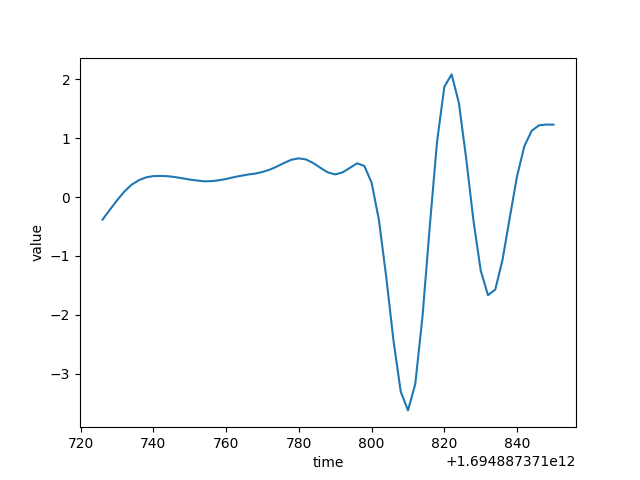
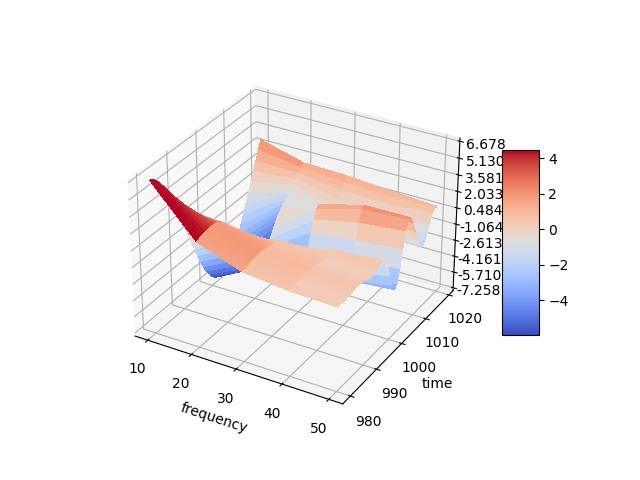
The next plot is both frequency domain and time domain. The time range is chosen to show the transition of the data to the anomalous region. You can see the transition to anomalous frequencies. The anomaly starts at time index 1000 as configured when generating the data. With sampling interval of 2 ms, that is 2 seconds into the time series.
A python package called pywt has been used for the implementation in a class called WaveletExpl. The driver code could be used as an example of how to call the wavelet API. The python module called tsgen has been used for synthetic time series data generation. For more detail on how to execute this case pleas refer to the tutorial.
The pywt wavelet package supports the following wavelet families.
'haar', 'db', 'sym', 'coif', 'bior', 'rbio', 'dmey', 'gaus', 'mexh', 'morl', 'cgau', 'shan', 'fbsp', 'cmor'
Each family may have one ore functions.Here is a complete list of all wavelet functions under all families
'bior1.1', 'bior1.3', 'bior1.5', 'bior2.2', 'bior2.4', 'bior2.6', 'bior2.8', 'bior3.1', 'bior3.3', 'bior3.5',
'bior3.7', 'bior3.9', 'bior4.4', 'bior5.5', 'bior6.8', 'cgau1', 'cgau2', 'cgau3', 'cgau4', 'cgau5', 'cgau6',
'cgau7', 'cgau8', 'cmor', 'coif1', 'coif2', 'coif3', 'coif4', 'coif5', 'coif6', 'coif7', 'coif8', 'coif9',
'coif10', 'coif11', 'coif12', 'coif13', 'coif14', 'coif15', 'coif16', 'coif17', 'db1', 'db2', 'db3', 'db4',
'db5', 'db6', 'db7', 'db8', 'db9', 'db10', 'db11', 'db12', 'db13', 'db14', 'db15', 'db16', 'db17', 'db18',
'db19', 'db20', 'db21', 'db22', 'db23', 'db24', 'db25', 'db26', 'db27', 'db28', 'db29', 'db30', 'db31',
'db32', 'db33', 'db34', 'db35', 'db36', 'db37', 'db38', 'dmey', 'fbsp', 'gaus1', 'gaus2', 'gaus3', 'gaus4',
'gaus5', 'gaus6', 'gaus7', 'gaus8', 'haar', 'mexh', 'morl', 'rbio1.1', 'rbio1.3', 'rbio1.5', 'rbio2.2',
'rbio2.4', 'rbio2.6', 'rbio2.8', 'rbio3.1', 'rbio3.3', 'rbio3.5', 'rbio3.7', 'rbio3.9', 'rbio4.4', 'rbio5.5',
'rbio6.8', 'shan', 'sym2', 'sym3', 'sym4', 'sym5', 'sym6', 'sym7', 'sym8', 'sym9', 'sym10', 'sym11', 'sym12',
'sym13', 'sym14', 'sym15', 'sym16', 'sym17', 'sym18', 'sym19', 'sym20'
Wrapping Up
Wavelet transform is very powerful in that it allows you to get frequency domain and time domain representations at the same time. There are various applications of wavelets, although the focus of this post is time series exploration.


