Time Series Sequence Anomaly Detection with Markov Chain
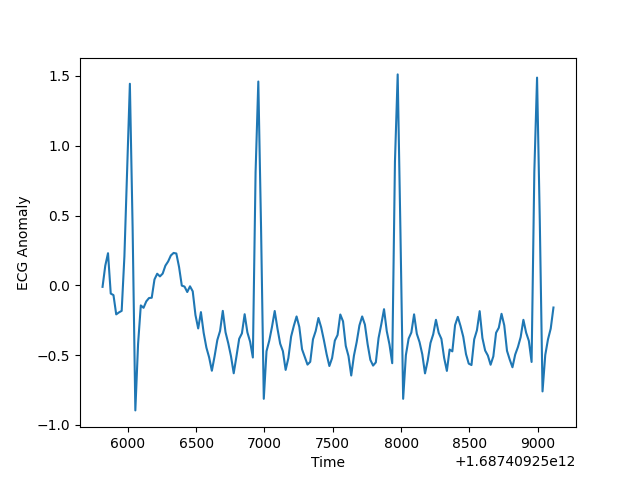
There are many algorithms for anomaly detection in time series including Deep Learning based solutions. The anomalies are of 2 types, point and sequence. Sequence anomaly detection is generally of more interest for time series data. In this post we will go through an anomaly detection technique based on the join probability of a sub sequence. The joint probability is approximated based on the first order Markov Chain assumption. We will use ECG data as an example. We will detect anomaly in the ECG data caused by an abnormal heart condition. The implementation is part of my Python package called zaman, which is all about time series. The code is in the GitHub repo whakapai. This repo contains code for all my published Python packages.
Markov Chain Model
Markov Chain Based anomaly detection is an unsupervised learning technique. This algorithm is ideal for symbolic sequence. But a time series can be converted to a symbolic sequence by discretizing. So the first step is this technique for time series or any numeric sequence data is to discretize the data based on discretization step size. This makes the time series data expressible with a finite set of integers. The core intuition in this approach is the joint probability of a discretized time series sub sequence p(xi,xi+1,,,xi+n) will be low if the sequence is anomalous.
However computation of empirical joint distribution requires enormous amount of data and is generally not feasible.The joint probability is approximated with the product of conditional probabilities based on first order Markov Chain assumption p(xi+n|xi+n-1)p(xi+n-1|xi+n-2)…p(xi+1|xi). First order Markov Chain is based on the assumption that any time series value only depends on the previous value.
With the first order Markov Chain assumption, what is required is to empirically build a state transition or conditional probability matrix. If there are n states after discretization of the time series data, the matrix will be of size n x n. Once the state transition probability matrix has been built, it can be used at inference time to estimate the joint probability of a sub sequence by using the conditional probabilities from the table and multiplying them. If the probability is below some pre defined threshold, then the sub sequence is flagged as anomalous.
The solution steps in my implementation are as follows
- Discretize training data. At training time build state transition probability matrix using normal data without anomaly, based on pairs of data in time series. Optionally, the model can be saved depending on a config parameter setting. The state transition probability matrix size will depend on the discretization step size (defined by the configuration parameter train.discrete.size) and the range of data
- Discretize inference data. For pre configured sub subsequence size, using a rolling window (window size defined by the configuration parameter pred.window.size) to calculate joint probability by using conditional probability values from state transition probability matrix. At inference time previously saved model can be used based on configuration settings. If the probability is below a pre defined threshold (defined by the configuration parameter pred.ano.threshold), it’s flagged as anomalous.
Time Series Sequence Anomaly Detection
The data is generated synthetically using the module tsgen in zaman. This module supports generation of various kinds of time series. I have used a motif based time series generation technique. You specify the motif sequence values. The values are repeated with an optional Gaussian zero mean random noise added. It also supports insertion of various kinds of anomalous data in a time series. The anomaly inserted is also motif based. Please refer to the tutorial doc for details on training and inference data is generated for ECG.

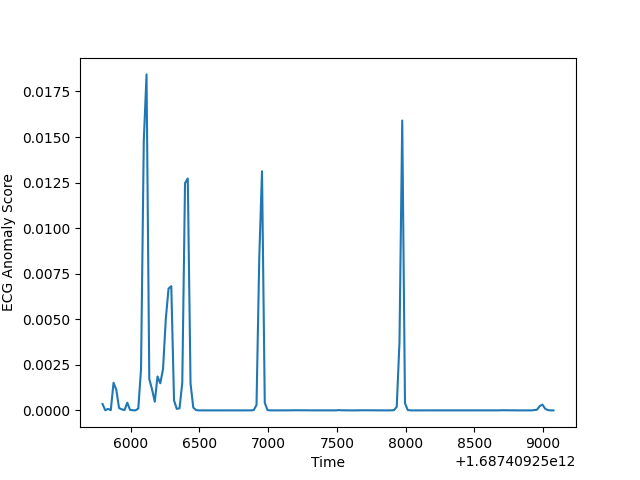
Here is a plot of anomaly score which is essentially the joint probability of a sub sequence. Selecting the right threshold level for anomaly score is always challenging. If not set correctly, you will get large number of False Positives or False negatives. Significant drop in the anomaly score signifies onset of anomalous data.

Having the knowledge of the presence of anomaly in the data made it easier to select the right threshold for the score i.e the probability value. Threshold value will depend on the size of the sub sequence over which the joint probability is calculated. Threshold should be lower for a larger sub sequence size. Please refer to the tutorial for steps to build the statistical model with training data and how to inference with test data.
Other Time Series Anomaly Detection Techniques
Here are some other techniques fortune series anomaly detection. The list doesn’t include Deep Learning based solutions. Local neighborhood based technique only works for point anomaly.
- Forecast based
- Decomposition based
- Dissimilarity based
- Local neighborhood based
- Ngram frequency based
- Segment based
- Frequency domain feature based
Wrapping Up
We have used a simple technique based joint probability of a subsequence to detect anomalous sequence in a time series. The implementation is generic and configuration driven. It can be easily used for any time series data with appropriate configurations.


