County-wise Drought and Weather Visualizations
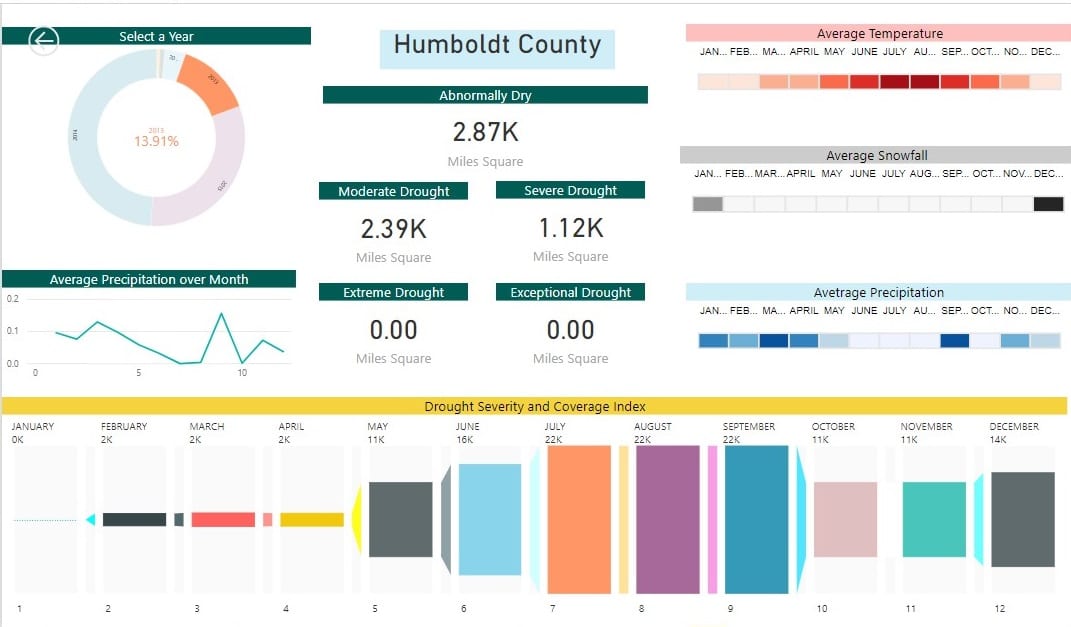
On drilling through a Specific year, a user will be led to this dashboard, which will give one a full insight into the trend and behavior of Drought & weather, that the county follows.
The tabular heatmaps show the trend that temperature, precipitation, and snowfall follows, month wise for a selected year.
The line chart shows the precipitation curve month wise & the data cards shows the portion of the land of the county that has been hit with that category of Drought over the year in miles square as its unit.
The Drought Severity & Coverage Index is an experimental method for converting drought levels from the U.S. Drought Monitor map to a single value for an area. DSCI values are part of the U.S. Drought Monitor data tables. If you want to compute it yourself, using cumulative Drought Monitor data, add the values for D0 through D4 to get the Drought Severity Classification Index. Or, to see more math, use categorical (not cumulative) Drought Monitor data, and compute a weighted sum:
1(D0) + 2(D1) + 3(D2) + 4(D3) + 5(D4) = DSCI
The bar height indicates the Severity of Drought based on the DSCI value. It helps a user to understand the trend that severity of Drought follows over a year and portrays the month on which the county has a tendency to be affected with Drought.
This dashboard gives the insight about Humboldt County. Conclusions that can be drawn from this dashboard is:
- For example, in the year 2013, the average Precipitation is low during the month of May to October whereas, the average Snowfall is high only during the month of December & January. As a result, the average Temperature increases from May to October
- Hence the severity of Drought is high from May to October.
Drought Analysis Visualizations
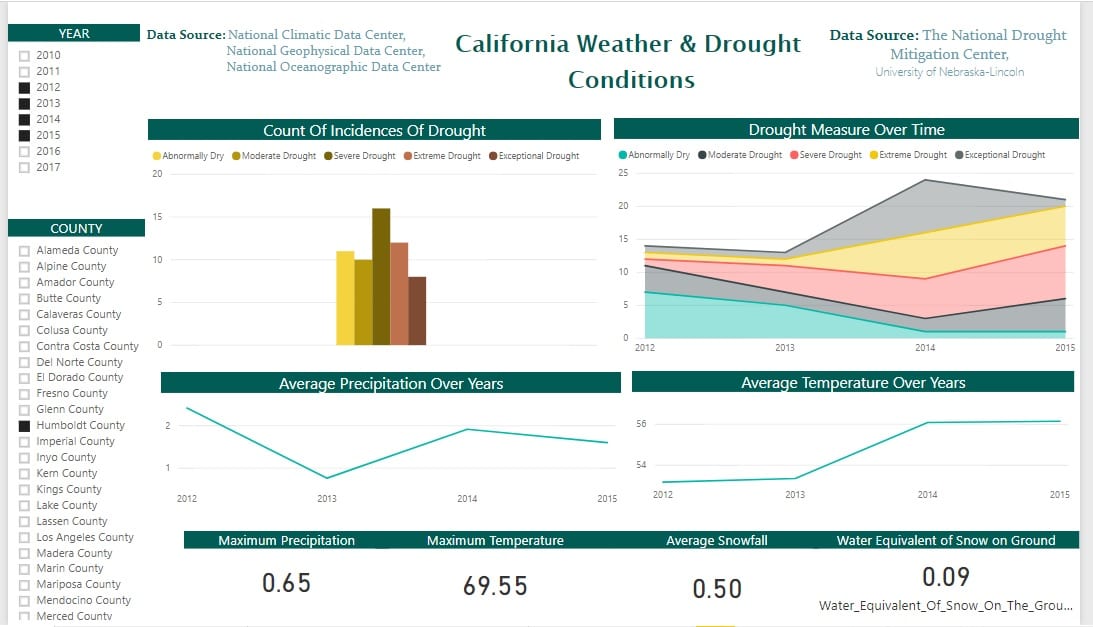
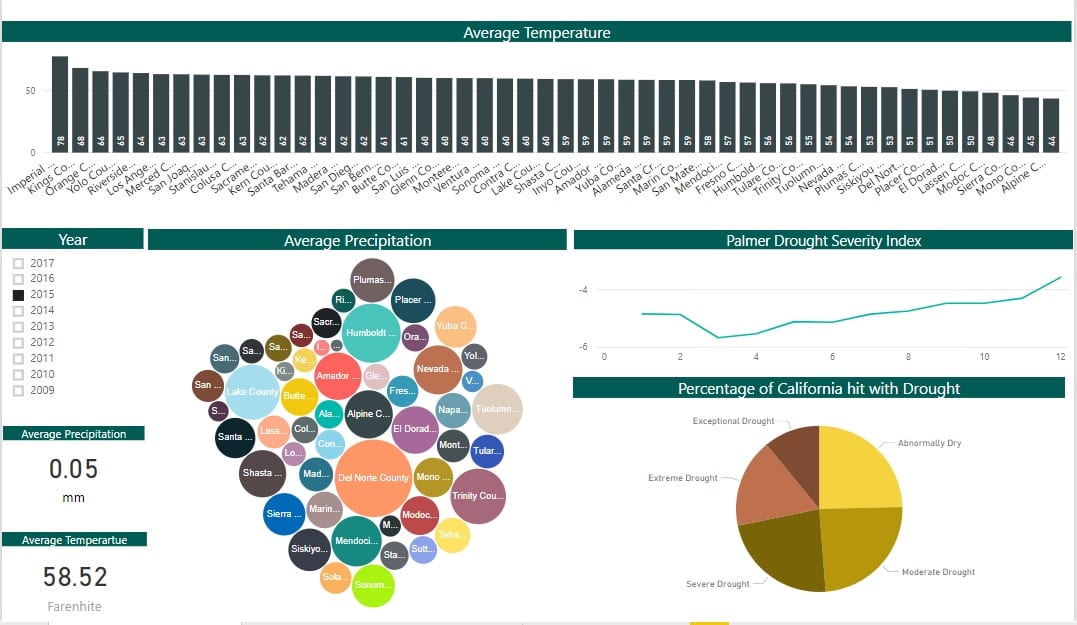
California is experiencing consecutive years of drought. As of late 2017, 47% of California was experiencing exceptional drought and more than 94% of the state was facing drought conditions that ranged from severe to exceptional.
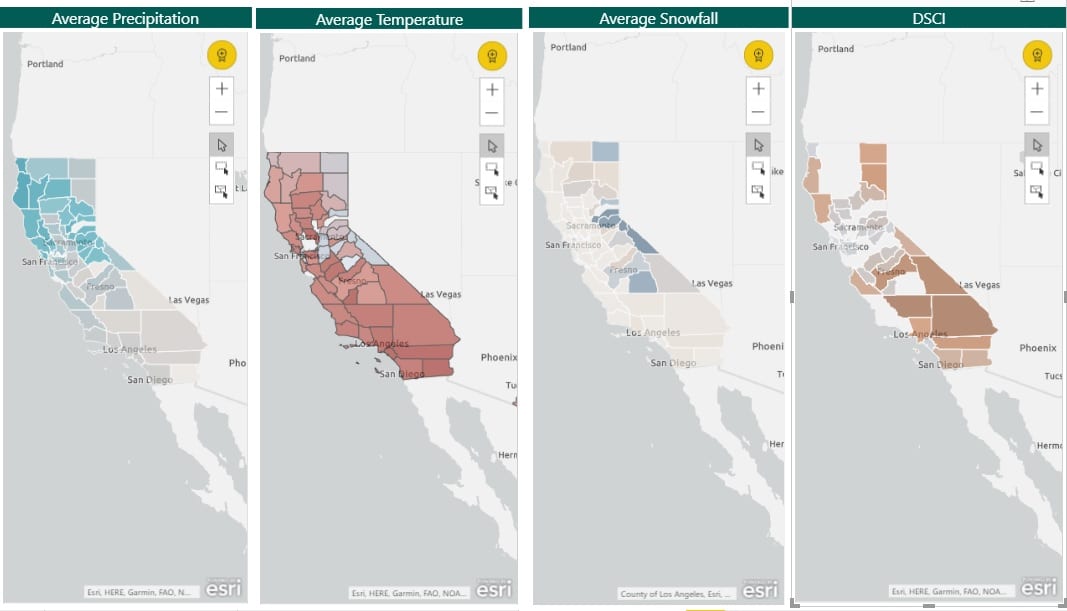
ThirdEye developed these visualizations by analyzing and correlating a variety of data and information on California’s current drought conditions. ThirdEye leveraged Microsoft PowerBI for developing these data visualizations.


