


Drought Analysis Visualizations
California is experiencing consecutive years of drought. As of late 2017, 47% of California was experiencing exceptional drought and more than 94% of the state was facing drought conditions that ranged from severe to exceptional.
ThirdEye developed these visualizations by analyzing and correlating a variety of data and information on California’s current drought conditions. ThirdEye leveraged Microsoft PowerBI for developing these data visualizations.
Drought Analysis Dashboard
Drought Analysis Report for the Whole State of California
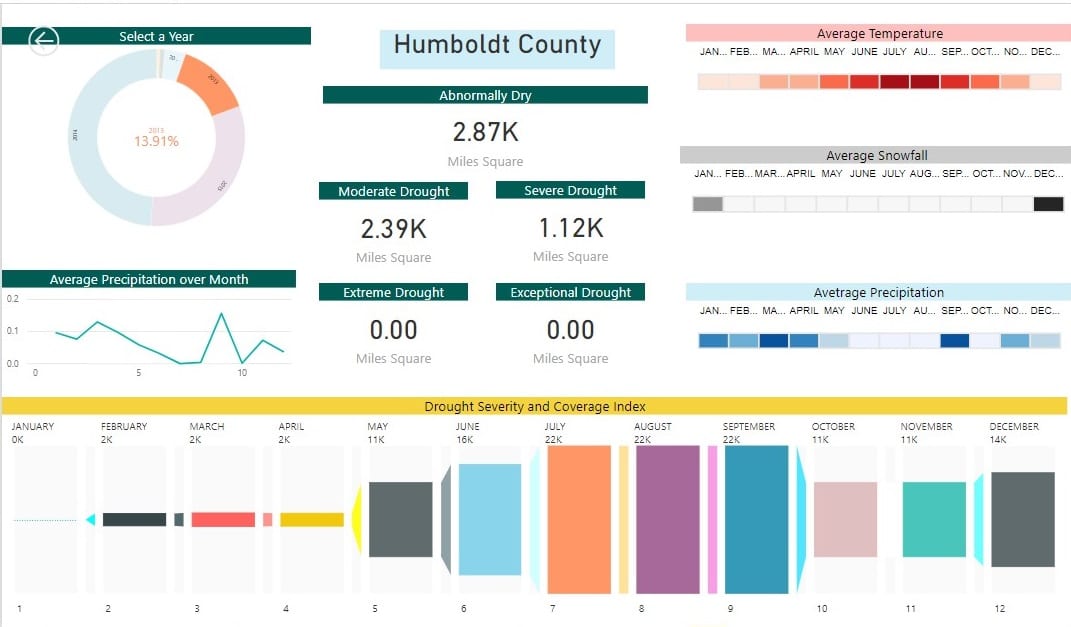
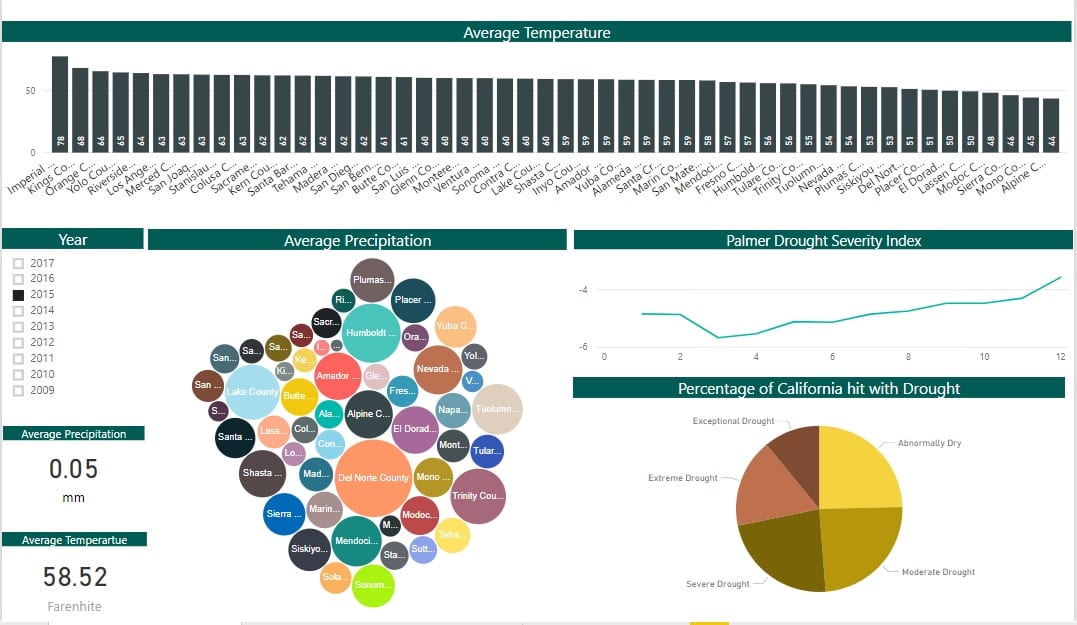
County-wise Drought and Weather Visualizations
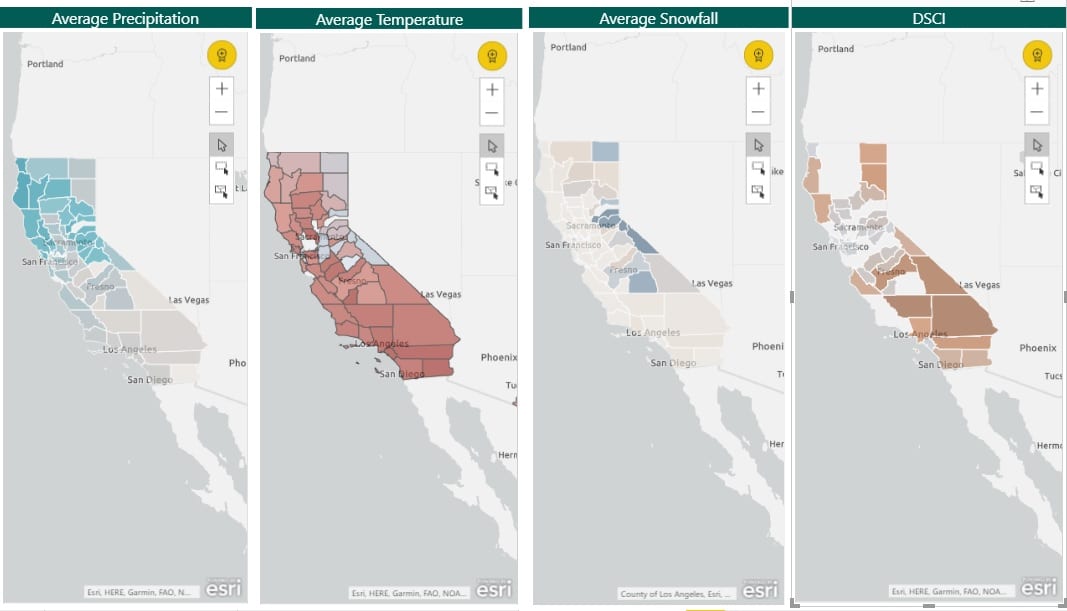
Drought Visualizations on Map
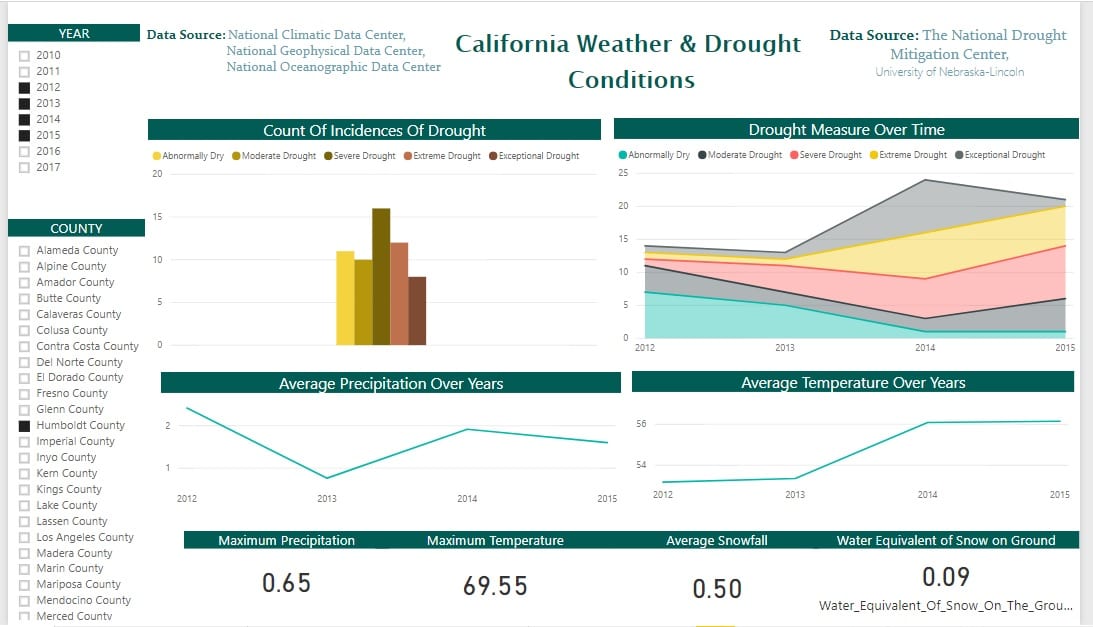
Drought Analysis Dashboard
This Drought Analysis dashboard helps a user to find out statistics about a particular County or a combination of Counties of the state of California for a particular year or over a range of years.
The dashboard shows the count of incidences of drought that has been recorded for the year or for the range of years. It also shows the increase or decrease of drought measures over time. The line charts have been used to plot the trend that the average precipitation & the average temperature is following for the year or for over the range of years.
The drill down feature in each line chart will give a user the ability to have an insight about the trend that average temperature & precipitation followed over months.
The cards give reading of maximum Precipitation, Temperature, Average Snowfall & water equivalent of snow on the ground for the particular county or selected counties for a particular selected year or over a range of years.
Drought Analysis Visualizations
California is experiencing consecutive years of drought. As of late 2017, 47% of California was experiencing exceptional drought and more than 94% of the state was facing drought conditions that ranged from severe to exceptional.
ThirdEye developed these visualizations by analyzing and correlating a variety of data and information on California’s current drought conditions. ThirdEye leveraged Microsoft PowerBI for developing these data visualizations.
Transforming Enterprises with
Data & AI Services & Solutions.
ThirdEye delivers Data and AI services & solutions for enterprises worldwide by
leveraging state-of-the-art Data & AI technologies.